. 2014 Mar;42(5):3044-58.
doi: 10.1093/nar/gkt1317. Epub 2013 Dec 24.

SUMOylation of the polycomb group protein L3MBTL2 facilitates repression of its target genes

Affiliations

SUMOylation of the polycomb group protein L3MBTL2 facilitates repression of its target genes

Christina Stielow et al. Nucleic Acids Res. 2014 Mar.

Abstract

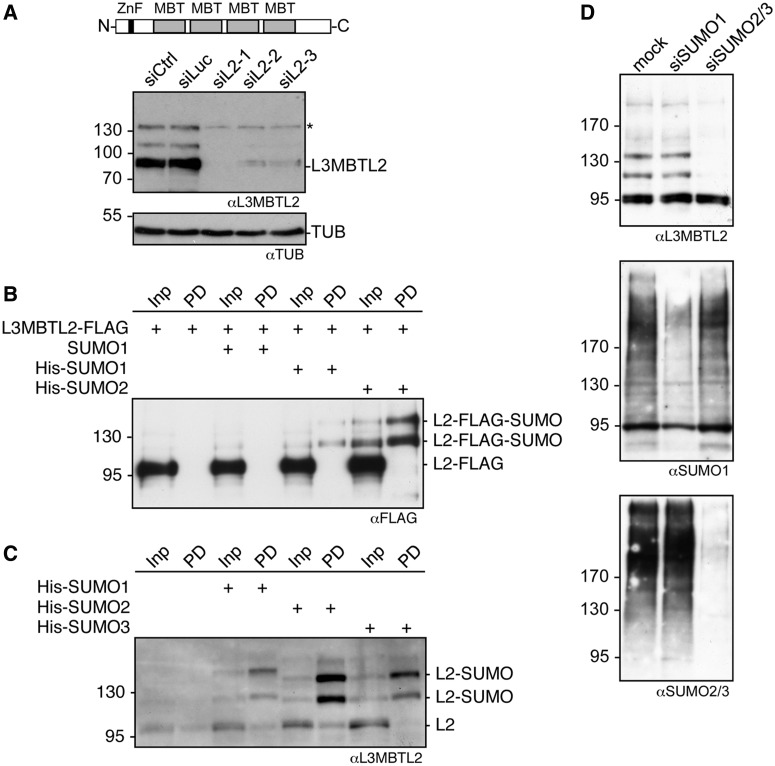
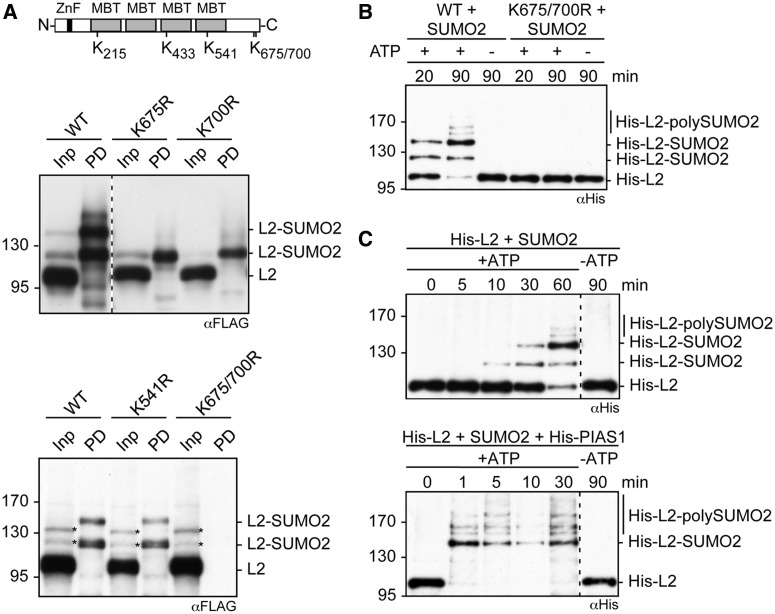
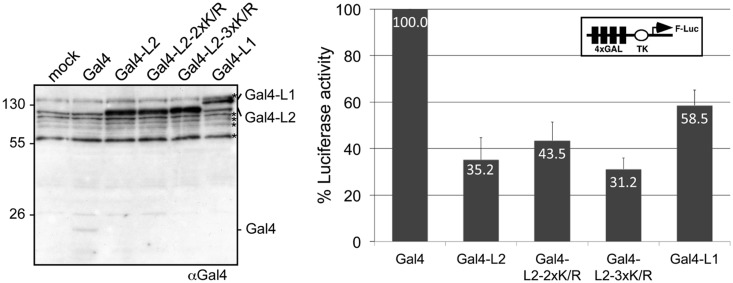
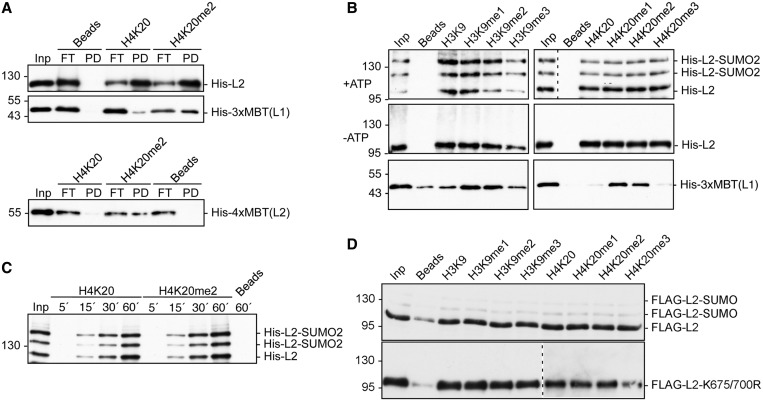
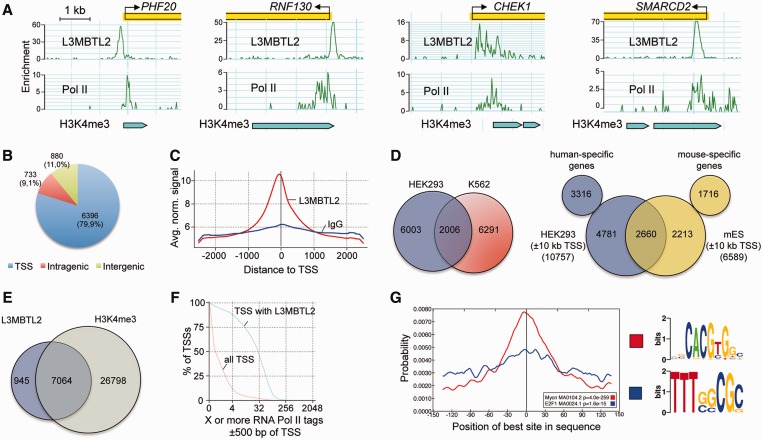
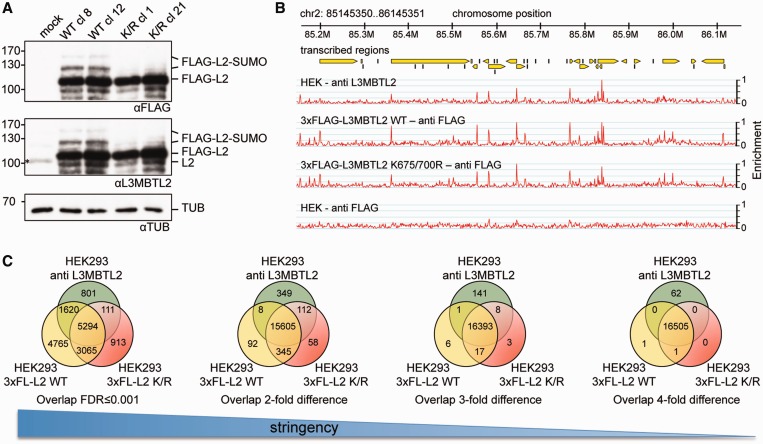
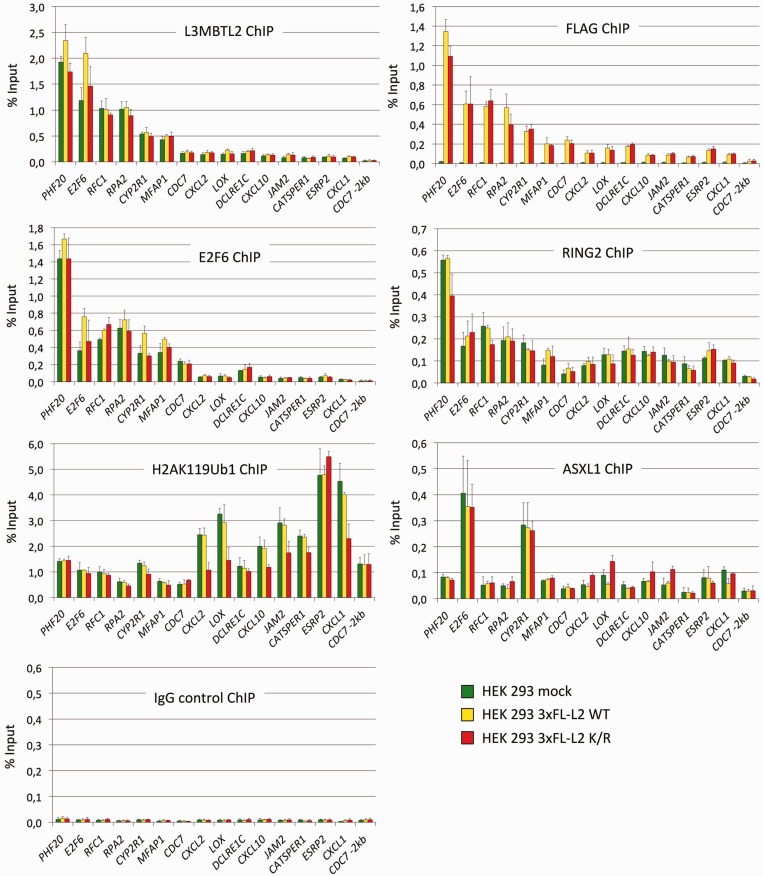
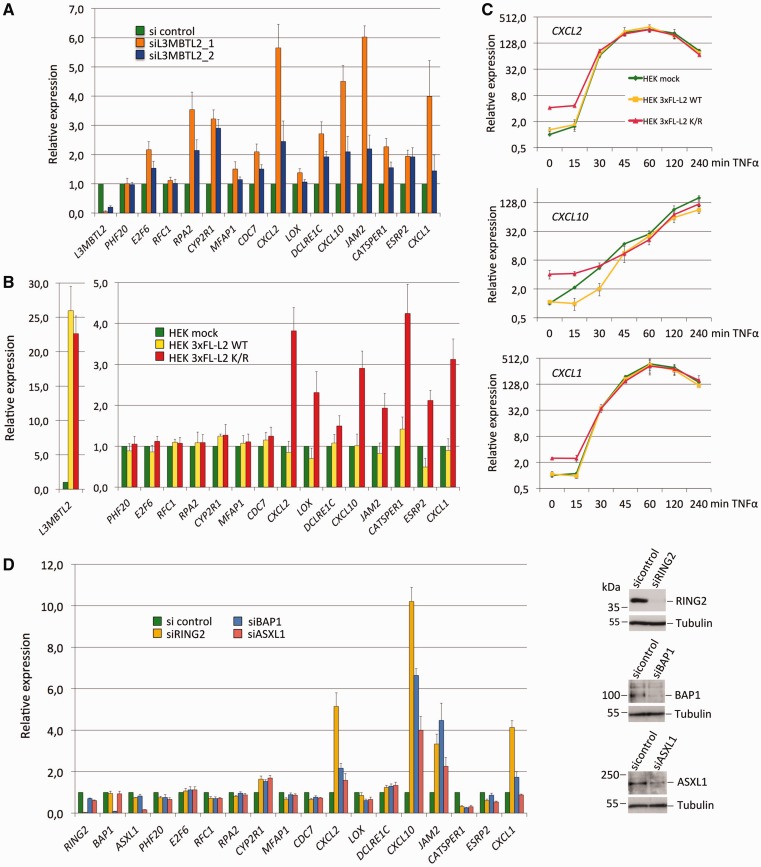
Lethal(3) malignant brain tumour like 2 (L3MBTL2) is an integral component of the polycomb repressive complex 1.6 (PRC1.6) and has been implicated in transcriptional repression and chromatin compaction. Here, we show that L3MBTL2 is modified by SUMO2/3 at lysine residues 675 and 700 close to the C-terminus. SUMOylation of L3MBTL2 neither affected its repressive activity in reporter gene assays nor it's binding to histone tails in vitro. In order to analyse whether SUMOylation affects binding of L3MBTL2 to chromatin, we performed ChIP-Seq analysis with chromatin of wild-type HEK293 cells and with chromatin of HEK293 cells stably expressing either FLAG-tagged SUMOylation-competent or SUMOylation-defective L3MBTL2. Wild-type FLAG-L3MBTL2 and the SUMOylation-defective FLAG-L3MBTL2 K675/700R mutant essentially occupied the same sites as endogenous L3MBTL2 suggesting that SUMOylation of L3MBTL2 does not affect chromatin binding. However, a subset of L3MBTL2-target genes, particularly those with low L3MBTL2 occupancy including pro-inflammatory genes, was de-repressed in cells expressing the FLAG-L3MBTL2 K675/700R mutant. Finally, we provide evidence that SUMOylation of L3MBTL2 facilitates repression of these PRC1.6-target genes by balancing the local H2Aub1 levels established by the ubiquitinating enzyme RING2 and the de-ubiquitinating PR-DUB complex.


Figures

Figure 1.
Figure 1.
L3MBTL2 is a target for SUMOylation. (A) Top, schematic presentation of human L3MBTL2. MBT domains are shown in grey, the C2/C2-zinc finger in black. Bottom, depletion of endogenous L3MBTL2. HEK293 cells were treated with a non-targeting control siRNA (siCtrl), a luciferase-targeting siRNA (siLuc), a pool of four L3MBTL2 siRNAs (siL2-1) or two distinct L3MBTL2 siRNAs (siL2-2 and siL2-3). L3MBTL2 protein levels in whole-cell extracts were analysed by western blotting. Re-probing for Tubulin served as a loading control. The asterisk denotes a cross-reacting protein that co-localises with the upper L3MBTL2-specific signal. (B) L3MBTL2-FLAG was transfected along with untagged SUMO1, His-tagged SUMO1 or His-tagged SUMO2 into HEK293 cells. His-SUMO-conjugated proteins were subsequently purified from cell lysates by Ni-NTA affinity chromatography (Ni-pulldown, PD). SUMOylated L3MBTL2-FLAG was detected by immunoblotting for the FLAG-tag. Input: 10%, pulldown (PD): 45%. (C) His-SUMO-conjugated proteins were purified by Ni-pulldown from HeLa cells stably expressing His-SUMO1, His-SUMO2 or His-SUMO3. Endogenous L3MBTL2 was subsequently detected by western blotting. Input: 10%, pulldown (PD): 45%. (D) HEK293 cells were transfected with shRNA expression constructs targeting SUMO1 or SUMO2/3 mRNA. Subsequently, whole-cell extracts were analysed for L3MBTL2, SUMO1 and SUMO2/3 protein levels by western blotting.
Figure 2.
Figure 2.
L3MBTL2 is SUMO-modified at lysines 675 and 700. (A) Top, position of lysine residues embedded in classical SUMO consensus sites (ΨKXE). Bottom, mutational analysis of potential SUMO acceptor lysines. The L3MBTL2-FLAG mutants K541R, K675R, K700R and K675/700R were expressed together with His-SUMO2 in HEK293 cells. His-SUMO2 conjugates were subsequently purified by Ni-pulldown and analysed for SUMOylated L3MBTL2-FLAG by western blotting using anti-FLAG antibodies. Input: 10%, pulldown (PD): 22.5%. The signals in the lower panel marked by asterisks were likely derived from cross-reacting proteins. (B) In vitro SUMOylation of L3MBTL2. Recombinant His-tagged wild-type L3MBTL2 or the L3MBTL2 K675/700R mutant was incubated with purified, recombinant E1 enzyme (AOS1/UBA2), E2 enzyme (UBC9) and SUMO2 in the presence or absence of ATP for the indicated time periods. The SUMOylation reactions were monitored by western blotting for His-L3MBTL2. (C) PIAS1 acts as an E3 ligase for L3MBTL2 SUMOylation in vitro. In vitro SUMOylation of wild-type L3MBTL2 was carried out as in (B) for the indicated time periods in the absence (top panel) or presence (bottom panel) of PIAS1 as indicated.
Figure 3.
Figure 3.
The L3MBTL2 K675/700R mutant retains repression activity in a reporter gene assay. HEK293 cells were transiently transfected with constructs expressing Gal4 (aa 1–147), Gal4-L3MBTL2 (Gal4-L2), Gal4-L3MBTL2 K675/700R (Gal4-L2-2xK/R), Gal4-L3MBTL2 K541/675/700R (Gal4-L2-3xK/R) or Gal4-L3MBTL1 (Gal4-L1), respectively, along with the 4xGal-TK-Luc reporter and a Renilla luciferase control reporter. Subsequently, whole-cell extracts were analysed for Gal4 expression (left panel) and luciferase activity (right panel). The reporter activity in the presence of Gal4 was set to 100%. Data are represented as mean ± SD of three independent experiments each performed in duplicate. The asterisks in the western-blot panel denote cross-reacting proteins.
Figure 4.
Figure 4.
Binding of unmodified and SUMOylated L3MBTL2 to histone H3 and H4 tails. (A) Peptide binding of recombinant L3MBTL2. Immobilized H4K20 and H4K20me2 peptides (residues 16–25) were incubated either with recombinant full-length His-L3MBTL2 (His-L2), 3xMBT-repeat domain of L3MBTL1 (His-3xMBT-L1) or the 4xMBT-repeat domain of L3MBTL2 (His-4xMBT, aa 170–619). Binding of His-L3MBTL2 was analysed by western blotting using anti-His antibodies. Inp, input: 10%, FT, flow through: 20% (upper panels) or 10% (lower panel), PD, pull-down: bound material. (B) Full-length His-L3MBTL2 was SUMOylated in vitro and subsequently incubated with N-terminal histone H3 (residues 1–15) or H4 peptides (residues 16–25) containing the indicated methylated lysines. The 3xMBT-repeat domain of L3MBTL1 served as a positive control for specific binding to mono- and di-methylated histone peptides. Detection of bound His-L3MBTL1/2 was by western blotting using anti-His antibodies. Input: 10%. (C) Time course of peptide binding of unmodified and SUMOylated L3MBTL2. In vitro SUMOylated full-length His-L3MBTL2 was incubated with unmethylated (H4K20) or di-methylated H4 (H4K20me2) peptides for 5, 15, 30 and 60 min as indicated. Detection of bound His-L3MBTL2 was by western blotting using anti-His antibodies. Input: 10%. (D) Wild-type 3xFLAG-L3MBTL2 and the 3xFLAG-L3MBTL2 K675/700R mutant were immunoprecipitated from N-ethylmaleimide-treated nuclear extracts of stably transfected HEK293 cells and subsequently incubated with the indicated histone H3 and H4 peptides. Detection of bound FLAG-L3MBTL2 was by western blotting using anti-FLAG antibodies. Input: 10%.
Figure 5.
Figure 5.
Overview of L3MBTL2 chromatin occupancy in HEK293 cells. (A) Examples of normalized HEK293 ChIP-Seq signals along with RNA polymerase II signals and H3K4me3 beds illustrate their co-occurrence at transcriptional start sites (TSSs). The plots show normalized ChIP-Seq signals for L3MBTL2, RNA polymerase II (GSM935534) and H3K4me3 beds (GSM945288) at the PHF20, RNF130, CHEK1 and SMARCD2 genes. (B) Distribution of L3MBTL2 occupancy relative to annotated genes. (C) Averaged L3MBTL2 coverage around TSSs in HEK293 cells normalized to 20 million reads. (D) Venn diagrams illustrating the overlap of L3MBTL2-binding sites between HEK293 and K562 (12) cells (left), and of L3MBT2 bound genes between HEK293 and mouse ES cells (14) (right). For HEK293/mES comparison, L3MBTL2 signals at ±10 kb of TSSs were used to assign bound genes (see Materials and methods section for details), because only a list of L3MBTL2 peaks ±10 kb was available for mouse ES cells. (E) Venn diagram illustrating the overlap between L3MBTL2 binding sites and the H3K4me3 signature (GSM945288) in HEK293 cells. (F) RNA polymerase II is enriched at TSSs with L3MBTL2 peaks. All TSSs (red line) and TSSs bound by L3MBTL2 (blue line) were plotted against RNA Pol II ChIP-Seq tag counts (GSM935534). (G) Centrally enriched sequence motifs at L3MBTL2-binding sites obtained by running Centrimo (27) with 300 bp summits of all 8006 FDR ≤ 0.001 L3MBTL2 sites.
Figure 6.
Figure 6.
Ectopically expressed wild-type L3MBTL2 and the SUMOylation-defective L3MBTL2 K675/700R mutant retain specific binding to L3MBTL2 target genes. (A) Western-blot analysis of stably transfected HEK293 cells expressing either 3xFLAG wild type L3MBTL2 (WT) or the 3xFLAG L3MBTL2 K675/700R mutant (K/R). Single clones were lysed in SDS-containing buffer and analysed for L3MBTL2 expression using either anti-FLAG- or anti-L3MBTL2-specific antibodies as indicated. Two representative wild type (WT cl 8 and 12) and mutant clones (K/R cl 1 and 21) are shown. Anti-tubulin staining served as a loading control. The asterisk in the middle panel of the mock lane denotes endogenous L3MBTL2. (B) Genome browser snapshots of ChIP-Seq patterns of endogenous L3MBTL2 (HEK—anti L3MBTL2) and ectopically expressed 3xFLAG-L3MBTL2 WT and 3xFLAG-L3MBTL2 K675/700R for a region on chromosome 2. ChIP-Seq with chromatin from parental HEK293 cells using an anti-FLAG antibody (HEK - anti FLAG, bottom panel) served as a negative control. Genomic coordinates and transcribed regions according to ENSEMBLE (yellow arrows) are indicated at the top. (C) Venn diagrams illustrating the overlap between endogenous L3MBTL2, 3xFLAG-L3MBTL2 WT and 3xFLAG-L3MBTL2 K675/700R-binding sites under different stringent filtering conditions. Left Venn diagram: overlap of binding sites with an FDR ≤ 0.001. The three Venn diagrams on the right side were obtained by merging the FDR ≤ 0.001 sites of all three ChIP-Seq datasets and subsequent comparison allowing for a 2-, 3- or 4-fold difference in read counts at individual peaks (see ‘Materials and Methods’ section for details).
Figure 7.
Figure 7.
ChIP-qPCR analysis of L3MBTL2 (L3MBTL2 ChIP and FLAG ChIP), E2F6, RING2, H2AK119ub1 and ASXL1 at selected L3MBTL2-bound regions genes in mock-transfected HEK293 cells (green bars) and in HEK293 cells expressing 3xFLAG-L3MBTL2 WT (yellow bars) or the 3xFLAG-L3MBTL2 K675/700R mutant (red bars). The percent of input values are mean ±SD of at least three independent experiments. A list of gene abbreviations is found in Supplementary Table S1.
Figure 8.
Figure 8.
Expression of L3MBTL2 target genes. (A) HEK293 cells were transfected with either a control siRNA (green bars) or with two different siRNAs targeting L3MBTL2 mRNA (orange and blue bars), and subsequently analysed for transcript levels of L3MBTL2, PHF20, E2F6, RFC1, RPA2, CYPR1, MFAP1, CDC7, CXCL2, LOX, DCLRE1C, CXCL10, JAM2, CATSPER1, ESPR2 and CXCL1. GAPDH and/or B2M (beta-2-microglobulin) transcript levels were used for normalisation. Normalized transcript levels are presented relative to the control siRNA set to 1. Data are presented as the mean of three independent experiments ±SD. (B) Mock-transfected HEK293 cells (green bars) and HEK293 cells expressing either 3xFLAG-L3MBTL2 WT (yellow bars) or the 3xFLAG-L3MBTL2 K675/700R mutant (red bars) were analysed for L3MBTL2-target gene expression. Normalized transcript levels are presented relative to mock-transfected cells set to 1. Data are presented as the mean of three independent experiments ±SD. (C) Mock-transfected HEK293 cells (green lines) and HEK293 cells expressing either 3xFLAG-L3MBTL2 WT (yellow lines) or the 3xFLAG-L3MBTL2 K675/700R mutant (red lines) were treated with 20 ng/ml of TNFα for the indicated time periods, and subsequently analysed for CXCL1, CXCL2 and CXCL10 transcript levels. Normalized transcript levels are presented relative to untreated mock-transfected cells set to 1. Data are presented ±SD. (D) HEK293 cells were transfected with pools of siRNAs targeting RING2, BAP1 or ASXL1 mRNA, and subsequently analysed for transcript levels of the indicated genes. GAPDH transcript levels were used for normalization. Data are presented as the mean of triplicates ±SD. The western blots on the right show reduction of RING2, ASXL1 and BAP1 protein levels upon siRNA treatment.

Similar articles

Cited by

References

    1. Maurer-Stroh S, Dickens NJ, Hughes-Davies L, Kouzarides T, Eisenhaber F, Ponting CP. The Tudor domain ‘Royal Family': Tudor, plant Agenet, Chromo, PWWP and MBT domains. Trends Biochem. Sci. 2003;28:69–74. - PubMed
    1. Grimm C, de Ayala Alonso AG, Rybin V, Steuerwald U, Ly-Hartig N, Fischle W, Muller J, Muller CW. Structural and functional analyses of methyl-lysine binding by the malignant brain tumour repeat protein Sex comb on midleg. EMBO Rep. 2007;8:1031–1037. - PMC - PubMed
    1. Santiveri CM, Lechtenberg BC, Allen MD, Sathyamurthy A, Jaulent AM, Freund SM, Bycroft M. The malignant brain tumor repeats of human SCML2 bind to peptides containing monomethylated lysine. J. Mol. Biol. 2008;382:1107–1112. - PubMed
    1. Li H, Fischle W, Wang W, Duncan EM, Liang L, Murakami-Ishibe S, Allis CD, Patel DJ. Structural basis for lower lysine methylation state-specific readout by MBT repeats of L3MBTL1 and an engineered PHD finger. Mol. Cell. 2007;28:677–691. - PMC - PubMed
    1. Min J, Allali-Hassani A, Nady N, Qi C, Ouyang H, Liu Y, MacKenzie F, Vedadi M, Arrowsmith CH. L3MBTL1 recognition of mono- and dimethylated histones. Nature Struct. Mol. Biol. 2007;14:1229–1230. - PubMed

Publication types

MeSH terms