Translational dynamics revealed by genome-wide profiling of ribosome footprints in Arabidopsis
- PMID: 24367078
- PMCID: PMC3890782
- DOI: 10.1073/pnas.1317811111
Translational dynamics revealed by genome-wide profiling of ribosome footprints in Arabidopsis
Abstract
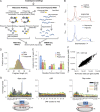
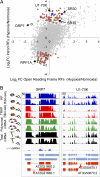
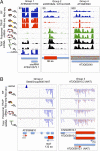
Translational regulation contributes to plasticity in metabolism and growth that enables plants to survive in a dynamic environment. Here, we used the precise mapping of ribosome footprints (RFs) on mRNAs to investigate translational regulation under control and sublethal hypoxia stress conditions in seedlings of Arabidopsis thaliana. Ribosomes were obtained by differential centrifugation or immunopurification and were digested with RNase I to generate footprint fragments that were deep-sequenced. Comparison of RF number and position on genic regions with fragmented total and polysomal mRNA illuminated numerous aspects of posttranscriptional and translational control under both growth conditions. When seedlings were oxygen-deprived, the frequency of ribosomes at the start codon was reduced, consistent with a global decline in initiation of translation. Hypoxia-up-regulated gene transcripts increased in polysome complexes during the stress, but the number of ribosomes per transcript relative to normoxic conditions was not enhanced. On the other hand, many mRNAs with limited change in steady-state abundance had significantly fewer ribosomes but with an overall similar distribution under hypoxia, consistent with restriction of initiation rather than elongation of translation. RF profiling also exposed the inhibitory effect of upstream ORFs on the translation of downstream protein-coding regions under normoxia, which was further modulated by hypoxia. The data document translation of alternatively spliced mRNAs and expose ribosome association with some noncoding RNAs. Altogether, we present an experimental approach that illuminates prevalent and nuanced regulation of protein synthesis under optimal and energy-limiting conditions.
Keywords: alternative splicing; long intergenic noncoding RNA; ribosome profiling; translational efficiency; uORF.
Conflict of interest statement
The authors declare no conflict of interest.
Figures


Similar articles
-
Global analysis of ribosome-associated noncoding RNAs unveils new modes of translational regulation.Proc Natl Acad Sci U S A. 2017 Nov 14;114(46):E10018-E10027. doi: 10.1073/pnas.1708433114. Epub 2017 Oct 30. Proc Natl Acad Sci U S A. 2017. PMID: 29087317 Free PMC article.
-
Genome-wide analysis of transcript abundance and translation in Arabidopsis seedlings subjected to oxygen deprivation.Ann Bot. 2005 Sep;96(4):647-60. doi: 10.1093/aob/mci217. Epub 2005 Aug 4. Ann Bot. 2005. PMID: 16081496 Free PMC article.
-
Ribosome profiling: a tool for quantitative evaluation of dynamics in mRNA translation.Methods Mol Biol. 2015;1284:139-73. doi: 10.1007/978-1-4939-2444-8_7. Methods Mol Biol. 2015. PMID: 25757771
-
Insights into the mechanisms of eukaryotic translation gained with ribosome profiling.Nucleic Acids Res. 2017 Jan 25;45(2):513-526. doi: 10.1093/nar/gkw1190. Epub 2016 Dec 6. Nucleic Acids Res. 2017. PMID: 27923997 Free PMC article. Review.
-
Ribosome profiling: a Hi-Def monitor for protein synthesis at the genome-wide scale.Wiley Interdiscip Rev RNA. 2013 Sep-Oct;4(5):473-90. doi: 10.1002/wrna.1172. Epub 2013 May 20. Wiley Interdiscip Rev RNA. 2013. PMID: 23696005 Free PMC article. Review.
Cited by
-
Global Analysis of Truncated RNA Ends Reveals New Insights into Ribosome Stalling in Plants.Plant Cell. 2016 Oct;28(10):2398-2416. doi: 10.1105/tpc.16.00295. Epub 2016 Oct 14. Plant Cell. 2016. PMID: 27742800 Free PMC article.
-
Ribo-uORF: a comprehensive data resource of upstream open reading frames (uORFs) based on ribosome profiling.Nucleic Acids Res. 2023 Jan 6;51(D1):D248-D261. doi: 10.1093/nar/gkac1094. Nucleic Acids Res. 2023. PMID: 36440758 Free PMC article.
-
Post-transcriptional regulation of photosynthetic genes is a key driver of C4 leaf ontogeny.J Exp Bot. 2017 Jan;68(2):137-146. doi: 10.1093/jxb/erw386. Epub 2016 Oct 18. J Exp Bot. 2017. PMID: 27756806 Free PMC article.
-
Conserved Upstream Open Reading Frame Nascent Peptides That Control Translation.Annu Rev Genet. 2020 Nov 23;54:237-264. doi: 10.1146/annurev-genet-112618-043822. Epub 2020 Sep 1. Annu Rev Genet. 2020. PMID: 32870728 Free PMC article. Review.
-
An Easy Method for Plant Polysome Profiling.J Vis Exp. 2016 Aug 28;(114):54231. doi: 10.3791/54231. J Vis Exp. 2016. PMID: 27684295 Free PMC article.
References
Publication types
MeSH terms
Substances
Associated data
- Actions
LinkOut - more resources
Full Text Sources
Other Literature Sources
Molecular Biology Databases

