Biomarker modeling of Alzheimer's disease
- PMID: 24360540
- PMCID: PMC3928967
- DOI: 10.1016/j.neuron.2013.12.003
Biomarker modeling of Alzheimer's disease
Abstract
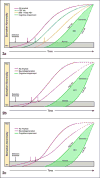
Alzheimer's disease (AD) is a slowly progressing disorder in which pathophysiological abnormalities, detectable in vivo by biomarkers, precede overt clinical symptoms by many years to decades. Five AD biomarkers are sufficiently validated to have been incorporated into clinical diagnostic criteria and commonly used in therapeutic trials. Current AD biomarkers fall into two categories: biomarkers of amyloid-β plaques and of tau-related neurodegeneration. Three of the five are imaging measures and two are cerebrospinal fluid analytes. AD biomarkers do not evolve in an identical manner but rather in a sequential but temporally overlapping manner. Models of the temporal evolution of AD biomarkers can take the form of plots of biomarker severity (degree of abnormality) versus time. In this Review, we discuss several time-dependent models of AD that take into consideration varying age of onset (early versus late) and the influence of aging and co-occurring brain pathologies that commonly arise in the elderly.
Copyright © 2013 Elsevier Inc. All rights reserved.
Figures


Similar articles
-
The Road Ahead to Cure Alzheimer's Disease: Development of Biological Markers and Neuroimaging Methods for Prevention Trials Across all Stages and Target Populations.J Prev Alzheimers Dis. 2014 Dec;1(3):181-202. doi: 10.14283/jpad.2014.32. J Prev Alzheimers Dis. 2014. PMID: 26478889 Free PMC article.
-
Comparison of analytical platforms for cerebrospinal fluid measures of β-amyloid 1-42, total tau, and p-tau181 for identifying Alzheimer disease amyloid plaque pathology.Arch Neurol. 2011 Sep;68(9):1137-44. doi: 10.1001/archneurol.2011.105. Epub 2011 May 9. Arch Neurol. 2011. PMID: 21555603 Free PMC article.
-
Fluid and PET biomarkers for amyloid pathology in Alzheimer's disease.Mol Cell Neurosci. 2019 Jun;97:3-17. doi: 10.1016/j.mcn.2018.12.004. Epub 2018 Dec 8. Mol Cell Neurosci. 2019. PMID: 30537535 Review.
-
Biomarkers in the Diagnosis and Prognosis of Alzheimer's Disease.J Lab Autom. 2015 Oct;20(5):589-600. doi: 10.1177/2211068214559979. Epub 2014 Nov 25. J Lab Autom. 2015. PMID: 25424384 Review.
-
Origins of Alzheimer's disease: reconciling cerebrospinal fluid biomarker and neuropathology data regarding the temporal sequence of amyloid-beta and tau involvement.Curr Opin Neurol. 2012 Dec;25(6):715-20. doi: 10.1097/WCO.0b013e32835a30f4. Curr Opin Neurol. 2012. PMID: 23041958 Free PMC article. Review.
Cited by
-
On the limits of graph neural networks for the early diagnosis of Alzheimer's disease.Sci Rep. 2022 Oct 21;12(1):17632. doi: 10.1038/s41598-022-21491-y. Sci Rep. 2022. PMID: 36271229 Free PMC article.
-
Association of amyloid-β CSF/PET discordance and tau load 5 years later.Neurology. 2020 Nov 10;95(19):e2648-e2657. doi: 10.1212/WNL.0000000000010739. Epub 2020 Sep 10. Neurology. 2020. PMID: 32913020 Free PMC article.
-
Reduced plasma desmosterol-to-cholesterol ratio and longitudinal cognitive decline in Alzheimer's disease.Alzheimers Dement (Amst). 2015 Mar 29;1(1):67-74. doi: 10.1016/j.dadm.2014.11.009. eCollection 2015 Mar. Alzheimers Dement (Amst). 2015. PMID: 27239493 Free PMC article.
-
Longitudinal cerebrospinal fluid biomarker measurements in preclinical sporadic Alzheimer's disease: A prospective 9-year study.Alzheimers Dement (Amst). 2015 Oct 9;1(4):403-11. doi: 10.1016/j.dadm.2015.09.002. eCollection 2015 Dec. Alzheimers Dement (Amst). 2015. PMID: 27239521 Free PMC article.
-
Current and future implications of basic and translational research on amyloid-β peptide production and removal pathways.Mol Cell Neurosci. 2015 May;66(Pt A):3-11. doi: 10.1016/j.mcn.2015.02.016. Epub 2015 Mar 4. Mol Cell Neurosci. 2015. PMID: 25748120 Free PMC article. Review.
References
-
- Albert MS, DeKosky ST, Dickson D, Dubois B, Feldman HH, Fox NC, Gamst A, Holtzman DM, Jagust WJ, Petersen RC, Snyder PJ, Phelps CH. The diagnosis of mild cognitive impairment due to Alzheimer's disease: Recommendations from the National Institute on Aging and Alzheimer's Association Workgroup. Alzheimers Dement. 2011;7:270–279. - PMC - PubMed
-
- Bateman RJ, Xiong C, Benzinger TL, Fagan AM, Goate A, Fox NC, Marcus DS, Cairns NJ, Xie X, Blazey TM, Holtzman DM, Santacruz A, Buckles V, Oliver A, Moulder K, Aisen PS, Ghetti B, Klunk WE, McDade E, Martins RN, Masters CL, Mayeux R, Ringman JM, Rossor MN, Schofield PR, Sperling RA, Salloway S, Morris JC. Clinical and Biomarker Changes in Dominantly Inherited Alzheimer's Disease. The New England journal of medicine. 2012;367:795–804. - PMC - PubMed
-
- Bennett DA, Schneider JA, Wilson RS, Bienias JL, Arnold SE. Neurofibrillary tangles mediate the association of amyloid load with clinical Alzheimer disease and level of cognitive function. Arch Neurol. 2004;61:378–384. - PubMed
-
- Bertram L, Lange C, Mullin K, Parkinson M, Hsiao M, Hogan MF, Schjeide BM, Hooli B, Divito J, Ionita I, Jiang H, Laird N, Moscarillo T, Ohlsen KL, Elliott K, Wang X, Hu-Lince D, Ryder M, Murphy A, Wagner SL, Blacker D, Becker KD, Tanzi RE. Genome-wide association analysis reveals putative Alzheimer's disease susceptibility loci in addition to APOE. American journal of human genetics. 2008;83:623–632. - PMC - PubMed
-
- Bobinski M, de Leon MJ, Wegiel J, Desanti S, Convit A, Saint Louis LA, Rusinek H, Wisniewski HM. The histological validation of post mortem magnetic resonance imaging-determined hippocampal volume in Alzheimer's disease. Neuroscience. 2000;95:721–725. - PubMed
Publication types
MeSH terms
Substances
Grants and funding
LinkOut - more resources
Full Text Sources
Other Literature Sources
Medical

