. 2013 Dec 23;203(6):895-905.
doi: 10.1083/jcb.201308068.

Novel septin 9 repeat motifs altered in neuralgic amyotrophy bind and bundle microtubules

Novel septin 9 repeat motifs altered in neuralgic amyotrophy bind and bundle microtubules

Xiaobo Bai et al. J Cell Biol. .

Abstract

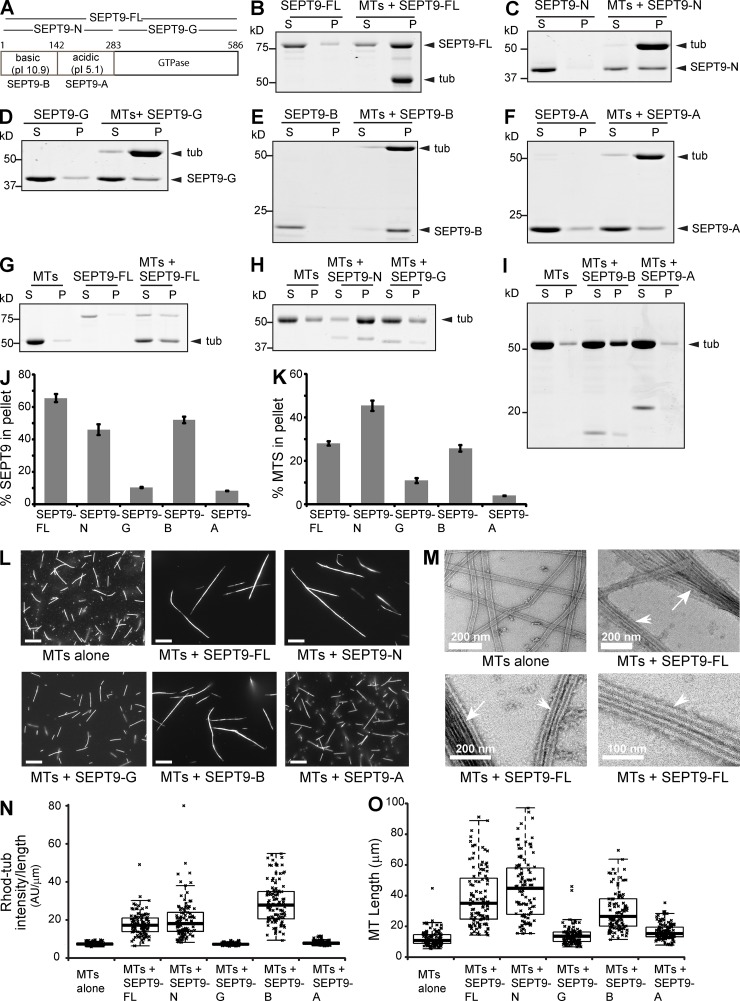
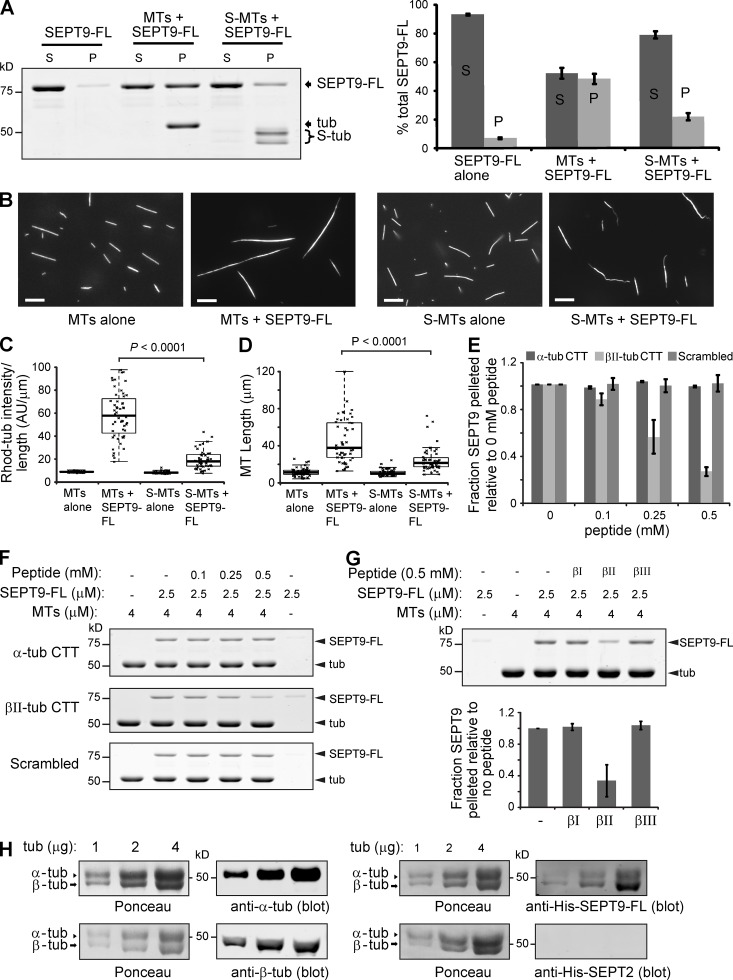
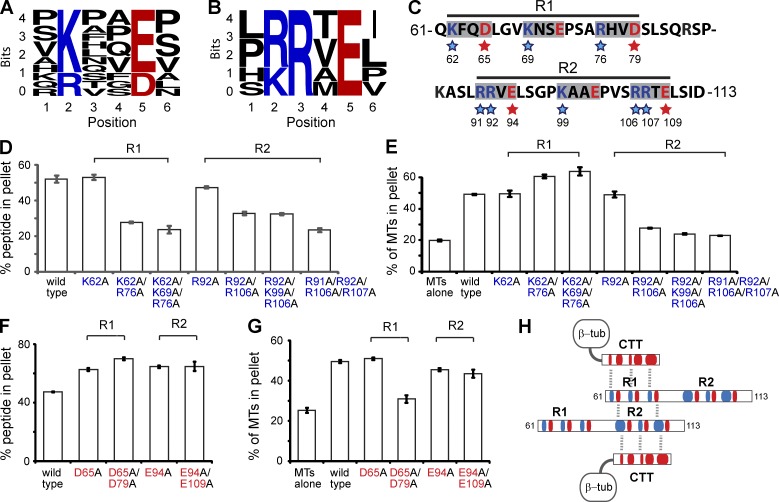
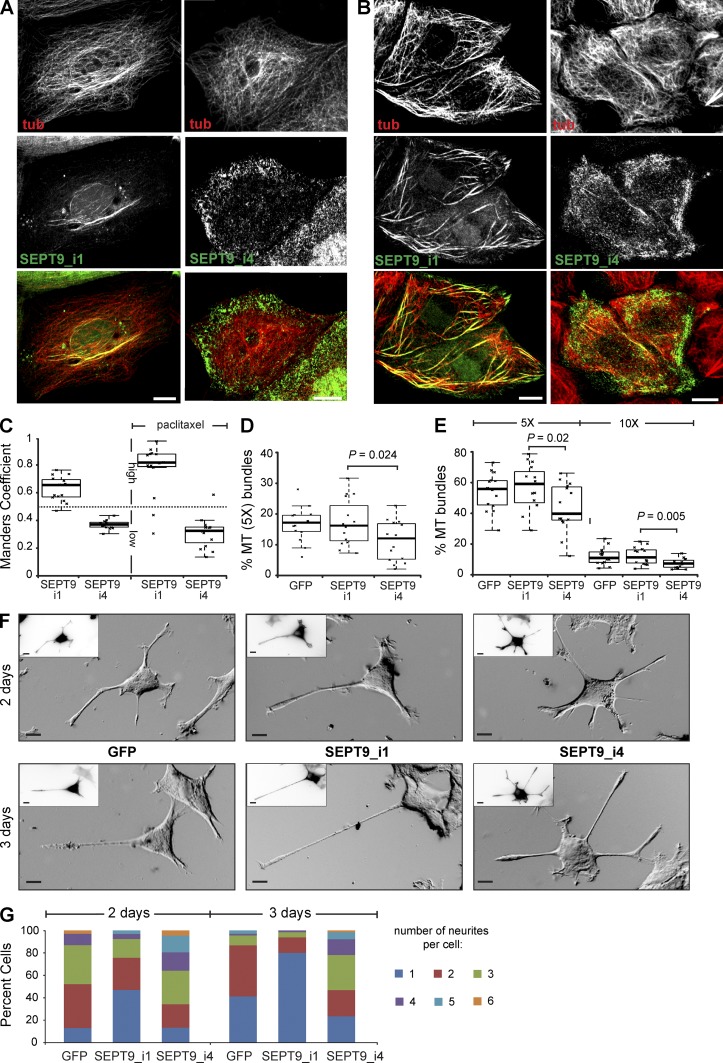
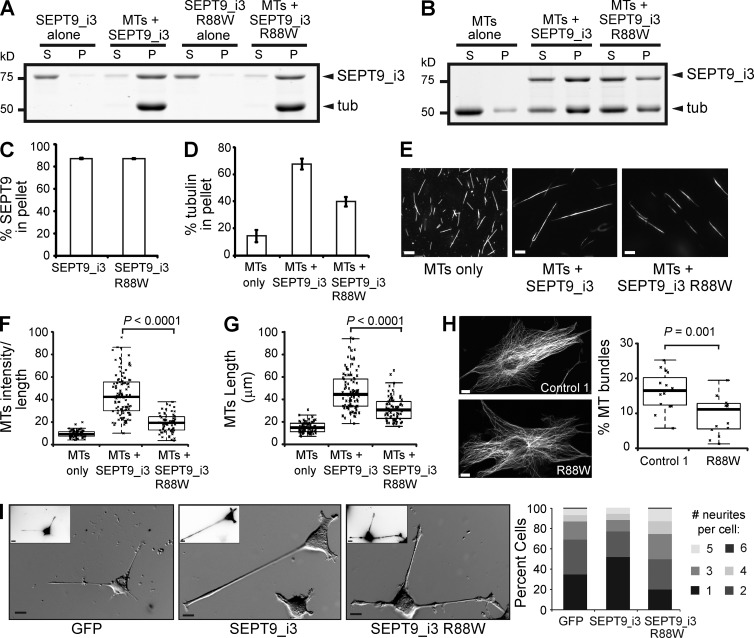
Septin 9 (SEPT9) interacts with microtubules (MTs) and is mutated in hereditary neuralgic amyotrophy (HNA), an autosomal-dominant neuropathy. The mechanism of SEPT9 interaction with MTs and the molecular basis of HNA are unknown. Here, we show that the N-terminal domain of SEPT9 contains the novel repeat motifs K/R-x-x-E/D and R/K-R-x-E, which bind and bundle MTs by interacting with the acidic C-terminal tails of β-tubulin. Alanine scanning mutagenesis revealed that the K/R-R/x-x-E/D motifs pair electrostatically with one another and the tails of β-tubulin, enabling septin–septin interactions that link MTs together. SEPT9 isoforms lacking repeat motifs or containing the HNA-linked mutation R88W, which maps to the R/K-R-x-E motif, diminished intracellular MT bundling and impaired asymmetric neurite growth in PC-12 cells. Thus, the SEPT9 repeat motifs bind and bundle MTs, and thereby promote asymmetric neurite growth. These results provide the first insight into the mechanism of septin interaction with MTs and the molecular and cellular basis of HNA.


Figures

Figure 1.
Figure 1.
SEPT9 binds and bundles MTs via a basic N-terminal domain. (A) Sequence and domains of SEPT9_i1. (B–F) Coomassie-stained SDS-PAGE gels of the supernatant (S) and pellet (P) fractions after high speed (39,000 g) sedimentation of pre-polymerized paclitaxel-stabilized MTs with domains of SEPT9_i1. (G–I) Low speed (8,000 g) sedimentation of MTs in the presence of SEPT9_i1 domains. (J and K) Graphs show percentages of total protein pelleted with MTs at 39,000 g (J) and percentage of total MTs pelleted at 8,000 g (K) in three independent experiments. (L) Images show X-rhodamine–labeled MTs after mixing with recombinant SEPT9 fragments. Bars, 10 µm. (M) Negative stain EM images of MTs before and after mixing with SEPT9_i1. Arrows and arrowheads point to MT bundles and doublets, respectively. (N and O) Plots show the intensity of X-rhodamine fluorescence per micron of MT (O; n = 100) and the length of MTs (P; n = 100) per condition.
Figure 2.
Figure 2.
SEPT9 interacts with the acidic C-terminal tails of β-tubulin. (A) Gel shows supernatant (S) and pellet (P) fractions after sedimentation (39,000 g) of SEPT9-FL with untreated and subtilisin-treated MTs (S-MTs). Graph shows percentage of total SEPT9-FL in the S and P fractions. (B) Images show untreated and subtilisin-treated X-rhodamine–labeled MTs after mixing with SEPT9-FL. Bars, 10 µm. (C and D) Plots show the fluorescence intensity per micron of MT (C; n = 50) and the length of MTs (D; n = 50). (E and F) Graph shows fraction of SEPT9-FL pelleted with MTs in the presence of increasing concentrations of α-tubulin, βII-tubulin, and scrambled CTT peptide relative to no peptide in three independent experiments. Gels show the pellet fractions after MT pelleting with SEPT9-FL in the presence of increasing concentrations of peptides. (G) Gels show the pellet fractions after sedimentation of MTs with SEPT9-FL in the presence of βI-, βII-, and βIII-tubulin CTT peptides. Graph shows the fraction of SEPT9-FL pelleted in the presence of peptides relative to no peptide in three independent experiments. (H) Increasing amounts of bovine brain tubulin was separated by 7.5% SDS-PAGE and transferred to nitrocellulose membranes, which were stained with Ponceau S red. Membranes were blotted with DM1A and TUB2.1 antibodies against α- and β-tubulin, respectively, and overlaid with His-tagged SEPT9-FL and SEPT2, which were detected with anti-His antibodies.
Figure 3.
Figure 3.
MT bundling by novel SEPT9 repeat motifs K/R-x-x-E/D and R/K-R-x-E. (A and B) WebLogo alignments of eleven hexapeptide sequences containing the K/R-x-x-E/D motif (A) and six sequences containing the R/K-R-x-E motif (B) within the N terminus (aa 1–286) of SEPT9_i1. The height of each residue indicates the frequency of its presence at the indicated positions. (C) Sequence of aa 61–113 of SEPT9_i1. The blue and red stars highlight the basic and acidic residues mutated to alanine. (D and E) Graphs show percentage of total SEPT9_i1(61–113) (wild-type and basic residue mutants) pelleted with MTs at 39,000 g (D), and percentage of total tubulin pelleted at 8,000 g (E) in three independent experiments. Representative gels are shown in Fig. S2. (F and G) Graphs show percentage of total 61–113 peptide (wild-type and acidic residue mutants) pelleted with MTs at 39,000 g (F), and percentage of total tubulin pelleted at 8,000 g (G) in three independent experiments. Representative gels are shown in Fig. S2. (H) Schematic shows a model of electrostatic interactions between the acidic (red) CTTs of tubulin and the basic (blue) residues of the SEPT9 repeat motifs. MT cross-linking is achieved by interactions between the acidic and basic residues of the K/R-x-x-E/D and R/K-R-x-E motifs, respectively.
Figure 4.
Figure 4.
SEPT9 repeat motifs are required for MT bundling and asymmetric neurite growth. (A and B) Maximal projections of 3D confocal microscopy images of MDCK cells expressing GFP-tagged SEPT9_i1 and SEPT9_i4 before (A) and after (B) treatment with 5 µM paclitaxel for 1.5 h. (C) Manders coefficients for the colocalization of GFP-tagged SEPT9_i1 and SEPT9_i4 with MTs in MDCK cells (n = 15). High and low colocalization are indicated by coefficients >0.5 and <0.5, respectively. (D and E) Plots show the fluorescence intensity of putative MT bundles with 5× and 10× the mean intensity of single MTs as percentage of total MT intensity in MDCK cells (n = 15) before (D) or after (E) treatment with paclitaxel. (F) Phase-contrast images show PC12 cells transfected with GFP and GFP-tagged SEPT9_i1 and SEPT9_i4 after a 2- and 3-d NGF treatment. Insets show GFP fluorescence in inverted monochrome. Bars, 10 µm. (G) Graph shows percentage of PC12 cells (n = 90) with one or more neurites. Pooled data from three independent experiments are shown.
Figure 5.
Figure 5.
HNA-linked mutation R88W impairs MT bundling and neurite asymmetry. (A and B) Gels show supernatant (S) and pellet (P) fractions from high (A; 39,000 g) and low (B; 8,000 g) speed MT-pelleting assays. (C and D) Graphs show percentages of total protein co-pelleted with MTs (C) and percentage of total tubulin pelleted (D) in three independent experiments. (E) Images show X-rhodamine–labeled MTs after mixing with recombinant SEPT9_i3 and SEPT9_i3(R88W). Bars, 10 µm. (F and G) Plots show the intensity of X-rhodamine fluorescence per micron of MT (F; n = 100) and the length of MTs (G; n = 100) per condition. (H) Images of dermal cells from healthy individual (control 1) and HNA patient with the R88W genotype stained for α-tubulin. Bars, 10 µm. Plot shows intensity of putative MT bundles with 5× the mean intensity of single MTs as percentage of total MT intensity (n = 15). (I) Phase-contrast images show PC12 cells transfected with GFP and GFP-tagged wild-type and R88W SEPT9_i3. Insets show GFP fluorescence in inverted monochrome. Graph shows percentage of cells (n = 90) with one or more neurites. Pooled data from three independent experiments are shown. Bars, 10 µm.

Similar articles

Cited by

References

    1. Akhmanova A., Steinmetz M.O.. 2008. Tracking the ends: a dynamic protein network controls the fate of microtubule tips. Nat. Rev. Mol. Cell Biol. 9:309–322. 10.1038/nrm2369 - DOI - PubMed
    1. Amos L.A., Schlieper D.. 2005. Microtubules and maps. Adv. Protein Chem. 71:257–298. 10.1016/S0065-3233(04)71007-4 - DOI - PubMed
    1. Bertin A., McMurray M.A., Grob P., Park S.S., Garcia G., III, Patanwala I., Ng H.L., Alber T., Thorner J., Nogales E.. 2008. Saccharomyces cerevisiae septins: supramolecular organization of heterooligomers and the mechanism of filament assembly. Proc. Natl. Acad. Sci. USA. 105:8274–8279. 10.1073/pnas.0803330105 - DOI - PMC - PubMed
    1. Bowen J.R., Hwang D., Bai X., Roy D., Spiliotis E.T.. 2011. Septin GTPases spatially guide microtubule organization and plus end dynamics in polarizing epithelia. J. Cell Biol. 194:187–197. 10.1083/jcb.201102076 - DOI - PMC - PubMed
    1. Butner K.A., Kirschner M.W.. 1991. Tau protein binds to microtubules through a flexible array of distributed weak sites. J. Cell Biol. 115:717–730. 10.1083/jcb.115.3.717 - DOI - PMC - PubMed

Publication types