. 2013 Dec 10;8(12):e83024.
doi: 10.1371/journal.pone.0083024. eCollection 2013.

Label retention identifies a multipotent mesenchymal stem cell-like population in the postnatal thymus

Affiliations

Label retention identifies a multipotent mesenchymal stem cell-like population in the postnatal thymus

Masako Osada et al. PLoS One. .

Abstract

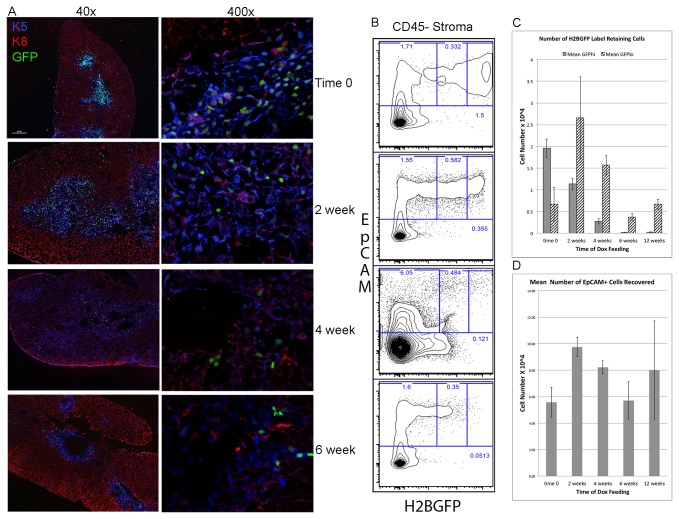
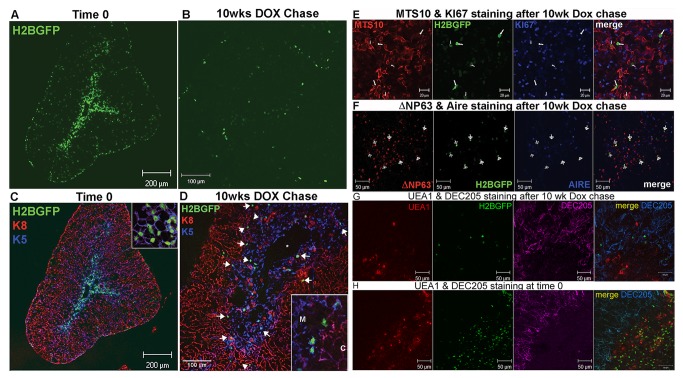
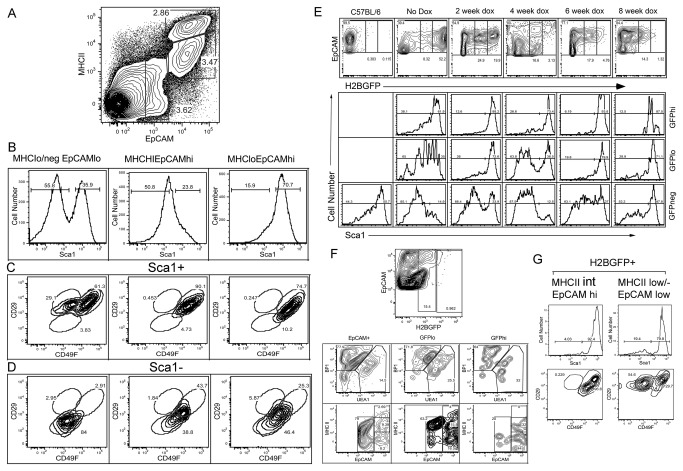
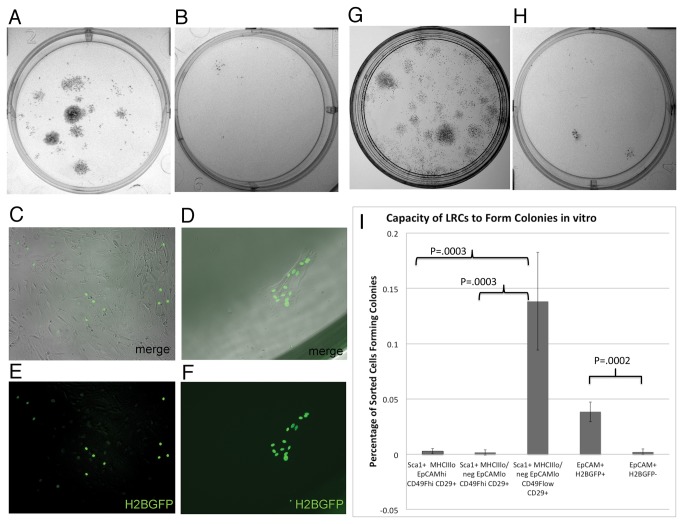
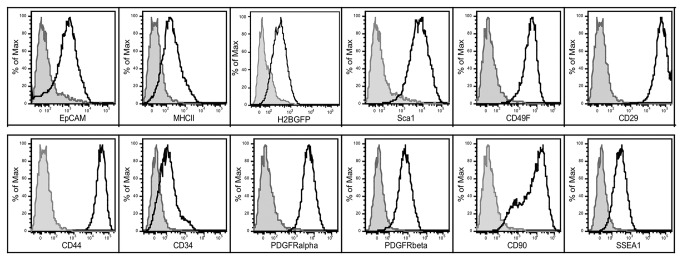
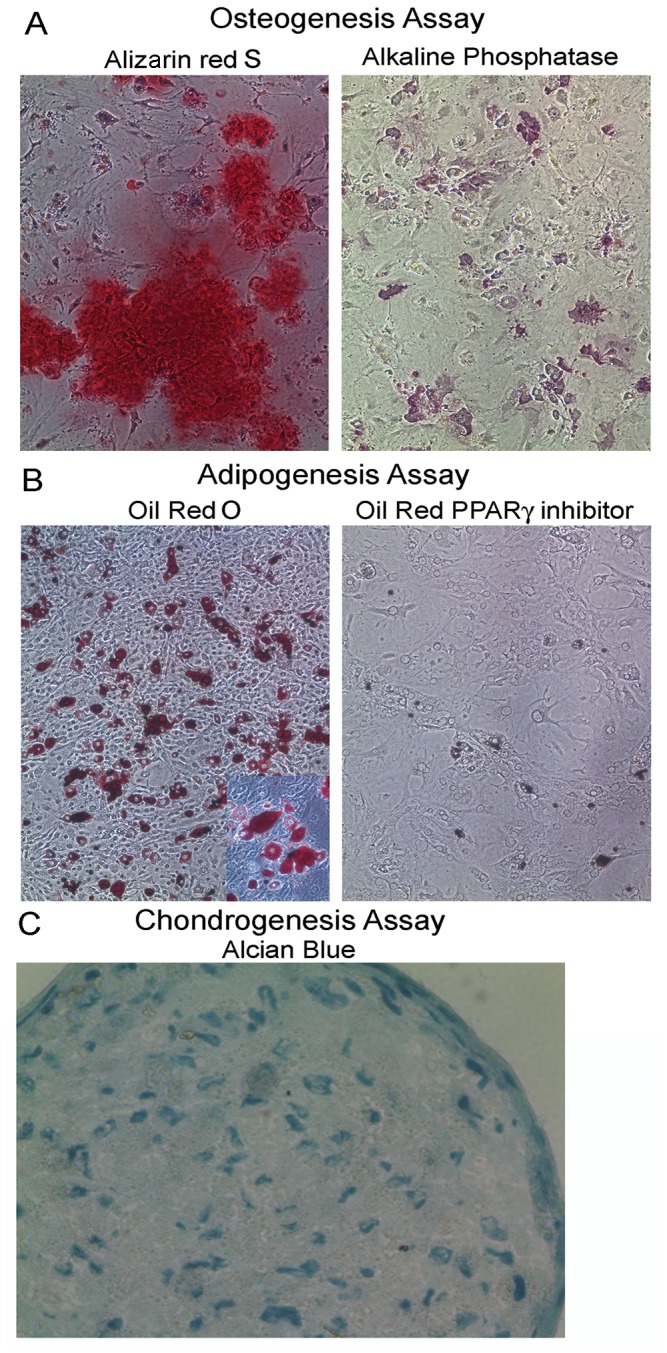
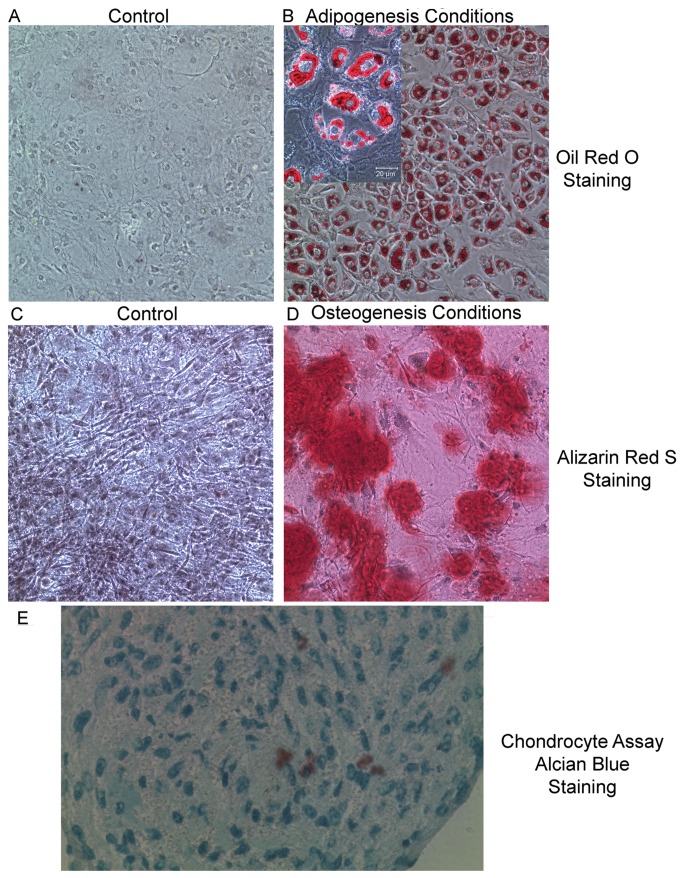
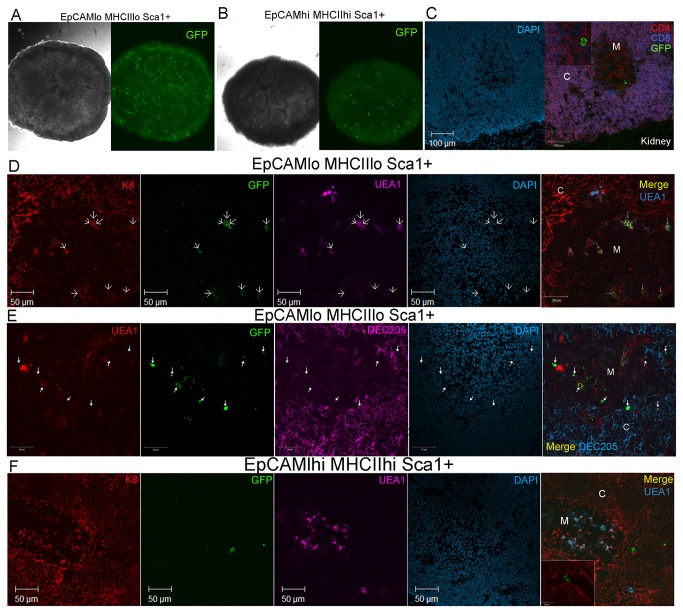
Thymic microenvironments are essential for the proper development and selection of T cells critical for a functional and self-tolerant adaptive immune response. While significant turnover occurs, it is unclear whether populations of adult stem cells contribute to the maintenance of postnatal thymic epithelial microenvironments. Here, the slow cycling characteristic of stem cells and their property of label-retention were used to identify a K5-expressing thymic stromal cell population capable of generating clonal cell lines that retain the capacity to differentiate into a number of mesenchymal lineages including adipocytes, chondrocytes and osteoblasts suggesting a mesenchymal stem cell-like phenotype. Using cell surface analysis both culture expanded LRCs and clonal thymic mesenchymal cell lines were found to express Sca1, PDGFRα, PDGFRβ,CD29, CD44, CD49F, and CD90 similar to MSCs. Sorted GFP-expressing stroma, that give rise to TMSC lines, contribute to thymic architecture when reaggregated with fetal stroma and transplanted under the kidney capsule of nude mice. Together these results show that the postnatal thymus contains a population of mesenchymal stem cells that can be maintained in culture and suggests they may contribute to the maintenance of functional thymic microenvironments.


Conflict of interest statement

Competing Interests: The authors have declared that no competing interests exist.

Figures

Figure 1
Figure 1. Changes in H2BGFP expression within TECs in K5tTA;TetO-H2BGFP transgenic mice following a time course of Dox feeding.
A. Thymic sections prepared at the initiation of Dox feeding and from 2-6 weeks after the start of Dox feeding showing the reduction in H2BGFP expressing TECs. Sections were stained with anti-K8 (red) and anti-K5 antibodies (blue) to allow localization of the H2BGFP expressing nuclei within TECs. B. Representative FACS analysis of CD45- dissociated thymic stroma showing the frequency of EpCAM+ H2BGFP+ cells at time 0, 2, 4 and 6 weeks after the initiation of Dox feeding to inhibit H2BGFP expression in K5+TECs. Gates from left to right in each panel show the frequency of EpCAM+H2BGFP-, EpCAM+H2BGFPlo and EpCAM+GFPhi TECs at each time point. C. Graph shows the mean number of EpCAM+H2BGFPhi label-retaining cells and the number of EpCAM+H2BGFPlo cycling cells per thymus at 0, 2, 4, 6 and 12 weeks after the inhibition of H2BGFP expression through Dox feeding. Error bars are +/- the standard deviation of the mean. Results are representative of 3 independent experiments with 5 mice at each time point/experiment. D. Graph depicts the mean number of CD45- EpCAM+ TECs/thymus at 0, 2, 4, 6 and 12 weeks after the inhibition of H2BGFP expression through Dox feeding. Error bars are +/- the standard deviation of the mean.
Figure 2
Figure 2. Localization and characterization of thymic label-retaining cells in K5tTA;TetO-H2BGFP mice.
A. H2BGFP expression in thymic section prior to Dox feeding (100X). B. H2BGFP expression in thymic section after 10-week Dox feeding. C. Overlay of H2BGFP (green), K8 (red) and K5 (blue) expression prior to Dox feeding. White arrows show H2BGFP LRCs concentrated at cortico-medullary junction defined by K5 and K8 staining (inset= K5, H2BGFP overlay 400X showing that H2BGFP is restricted to K5-expressing cells). D. Overlay of H2BGFP, K8 and K5 in thymic section following 10-week Dox chase (inset: 400X of H2BGFP LRCs stained with K5 and K8 at CMJ). E. 400x images of thymic sections showing expression of MTS10, H2BGFP, Ki67 and merge. White arrows define position of H2BGFPhi LRCs. F. 400X images of thymic sections showing expression of ΔNP63, H2BGFP, Aire and merge. White arrows define position of H2BGFPhi LRCs. G 400x images of thymic sections showing staining with UEA1 PE (red) and DEC 205 Alexa 647 (pink) together with H2BGFP and Merge. H. 400x images of thymic sections derived from K5tTA;tetO-H2BGFP mice prior to Dox feeding stained with UEA1PE (red) and DEC205 Alexa 647(Pink) together with H2BGFP and merge.
Figure 3
Figure 3. LRCs become progressively enriched in Sca1+TECs and contain a unique subset of MHCIIloEpCAMloSca1+CD49FloCD29+ cells.
A. Gating strategy for analysis of TEC subsets defined by MHCII and EpCAM expression in C57BL/6J dissociated thymic tissue. B. Sca1 expression within the 3 subsets defined by MHCII and EpCAM expression. C. Characterization of CD49F and CD29 expression within the Sca1+ TECs defined by MHCII and EpCAM expression. The MHCIIloEpCAMlo Sca1+ TECs contain a unique CD49FloCD29+ subset not found in other populations defined by MHCII and EpCAM expression or within Sca1- TEC subsets. D. Characterization of CD49F and CD29 expression within the Sca1- TECs defined by MHCII and EpCAM expression. E. Sca1 expression within the subsets of LRCs during an 8-week Dox time course. F. Characterization of EpCAM+ LRCs following 10-week Dox feeding. Upper panel shows gating used to define H2BGFPhi and H2BGFPlo subsets of LRCs. Middle 3 panels show characterization of total EpCAM+ as well as H2BGFPlo and H2BGFPhi LRCs using BP1 to define cTECs and UEA1 to define mTECs. Lower 3 panels show expression of MHCII and EpCAM in the same 3 populations. G. H2BGFP+ LRCs were separated into MHCIIloEpCAMhi and MHCIIlo/- EPCAMlo subsets and then analyzed for Sca1 expression (upper row). Sca1+ cells in each population were then analyzed for CD29 and CD49F. Results were representative of 5 independent experiments.
Figure 4
Figure 4. In vitro growth potential of H2BGFP LRCs.
Methylene blue stained colonies derived from FACS sorted CD45- EpCAMlo MHCIIlo/-Sca1+H2BGFP+ LRCs (A) or CD45-MHCIIintEpCAMhi Sca1+ H2BGFP+ stroma (B). C. Merge of H2BGFP expression and phase contrast image of expanded EpCAMloMHCIIlo/- H2BGFP+ LRCs 1 week after sorting, demonstrating dramatic in vitro growth. D. Merge of H2BGFP expression and phase contrast image showing limited expansion of EpCAMhi MHCIIintH2BGFP+ LRCs 1 week after sorting. E. H2BGFP expression in same field as C. F. H2BGFP expression in same field as D. These results are representative of 3 independent experiments performed with 10-12 week Dox fed H2BGFP mice. Methylene blue stained colonies derived from FACS sorted CD45-MHCIIlo/-EpCAMlo Sca1+CD49Flo CD29+ (G) or CD45-MHCIIintEpCAMhiSca1+CD49FhiCD29+ stroma (H) derived from WT C57BL/6J mice. I. Colony forming potential of sorted LRCs and defined TEC subsets sorted from dissociated thymus derived from postnatal C57BL/6J mice. Error bars show standard deviation of means calculated from 5 independent experiments. P values are derived by comparison of colony forming potential of sets of populations using T test.
Figure 5
Figure 5. Culture expanded CD45- MHCIIlo/-EpCAMlo Sca1+ CD49FloCD29+H2BGFP LRCs maintain a surface phenotype similar to mesenchymal stem cells.
After expanding sorted EpCAMlo LRCs for 5 passages in vitro, their cell surface profile for a panel of TEC and mesenchymal stem cell surface proteins using flow cytometry. Overlay histograms show a comparison of staining for each antibody including EpCAM, MHCII, H2BGFP, Sca1, CD49F CD29, CD44, CD34, PDGFRα PDGFRβ, CD90 and SSEA in open histograms with the relevant isotype control antibody conjugated to the same fluorochrome in gray shaded histograms. The negative control for H2BGFP expression was TMSCs derived from C57BL/6J mice.
Figure 6
Figure 6. H2BGFP+ LRCs cultured in vitro exhibit the capacity to differentiate into adipocytes, osteoblasts and chondrocytes.
A. (Left panel), Alizarin red staining of mineral deposits in culture-expanded FACS sorted CD45-Sca1+EpCAMlo MHCIIloH2BGFP LRCs following 2-weeks in conditions that promote Osteogenesis; (Right panel), alkaline phosphatase activity characteristic of osteocytes, detected with DAB. B. Abundant oil red+ cells following 2 weeks of culture in adipogenesis conditions (inset shows 400X image of Oil red stained lipid deposits). C. Section of chondro-nodule stained with Alcian blue to detect mucin secreted by chondrocytes.
Figure 7
Figure 7. Clonal TMSC lines maintain the capacity to form Adipocytes, Osteoblasts and Chondrocytes in vitro.
A. TMSC7 cell line cultured in MEMα medium supplemented with EGF, FGF and LIF and then stained with Oil Red O; B. Oil Red S staining of TMSC7 cultured in KSFM + 10% FBS + EGF which induced adipogenesis (inset 400X image of Oil Red O staining droplets of lipid); C. Alizarin Red S staining of TMSC7 cultured in control medium; D. Alizarin Red S staining of mineral deposits in TMSC7 cultured in osteogenesis differentiation medium; E. Alcian Blue staining of frozen section of Chondro-nodule following culture of TMSC7 cultured in chondrogenesis conditions. (Mag. A - D, 100X; inset and E 400X) Similar results for all differentiation assays were obtained in a minimum of 3 experiments and with multiple TMSC lines.
Figure 8
Figure 8. Sorted EpCAMlo MHCIIlo Sca1+ TECs contribute to thymic reaggregates after transplant under the nude mouse kidney capsule.
A. 40x phase and GFP fluorescence images of a reaggregate thymus created from sorted EpCAMloMHCIIloSca1+ TEC derived from B6eGFP mice mixed with dissociated B6 E15.5 fetal thymus. B. 40x phase (left) and GFP fluorescence images (right) of a reaggregate thymus created from sorted EpCAMlhiMHCIIhiSca1+ TEC derived from B6eGFP mice mixed with dissociated B6 E15.5 fetal thymus. C. 200X confocal fluorescence images of a 10μm frozen section prepared an EpCAMloMHCIIloSca1+ reaggregate thymus under the kidney capsule of a nude mouse stained with DAPI (left) and anti CD4PE (red), anti-CD8APC (blue) and anti-GFP FITC (green). The kidney is clearly visible on the lower right of each panel. D. Localization of sorted EpCAMlo MHCIIlo Sca1+ GFP+ cells retained in sections of reaggregate thymus grown under nude mouse kidney capsule for 3 weeks. Arrows indicate the location of GFP+ cells in each panel. Sections were stained with anti Keratin 8-PE (red), antiGFP-FITC (green), UEA1 APC (pink) and DAPI (blue). Upper 5 cells were K8+UEA1+ while lower 3 only expressed K8. E. Sections of reaggregates containing EpCAMloMHCIIloSca1+ adult TECs stained with UEA1PE (red), Anti-GFP FITC (green) DEC205 Alexa647 (pink) and DAPI (blue). In the last merged panel GFP+ adult cells included UEA1+ and UEA1- mTECs, as well DEC205+ cTECs. F. Localization of sorted EpCAMhi MHCIIhi Sca1+ GFP+ cells retained in sections of reaggregate thymus grown under nude mouse kidney capsule for 3 weeks. Arrows indicate the location of GFP+ cells in each panel. Sections were stained with anti Keratin 8-PE (red), antiGFP-FITC (green), UEA1 APC (pink) and DAPI (blue). White C= cortex, White M= medulla in all panels.

Similar articles

Cited by

References

    1. Anderson G, Jenkinson EJ (2001) Lymphostromal interactions in thymic development and function. Nat Rev Immunol 1: 31-40. doi:10.1038/35095500. PubMed: 11905812. - DOI - PubMed
    1. Savage PA, Davis MM (2001) A kinetic window constricts the T cell receptor repertoire in the thymus. Immunity 14: 243-252. doi:10.1016/S1074-7613(01)00106-6. PubMed: 11290334. - DOI - PubMed
    1. Gotter J, Brors B, Hergenhahn M, Kyewski B (2004) Medullary epithelial cells of the human thymus express a highly diverse selection of tissue-specific genes colocalized in chromosomal clusters. J Exp Med 199: 155-166. doi:10.1084/jem.20031677. PubMed: 14734521. - DOI - PMC - PubMed
    1. Kyewski B, Derbinski J (2004) Self-representation in the thymus: an extended view. Nat Rev Immunol 4: 688-698. doi:10.1038/nri1436. PubMed: 15343368. - DOI - PubMed
    1. Gillard GO, Farr AG (2006) Features of medullary thymic epithelium implicate postnatal development in maintaining epithelial heterogeneity and tissue-restricted antigen expression. J Immunol 176: 5815-5824. PubMed: 16670287. - PubMed

Publication types

MeSH terms