. 2013 Dec 12;504(7479):311-4.
doi: 10.1038/nature12833.

Primary cilia are specialized calcium signalling organelles

Affiliations

Primary cilia are specialized calcium signalling organelles

Markus Delling et al. Nature. .

Abstract

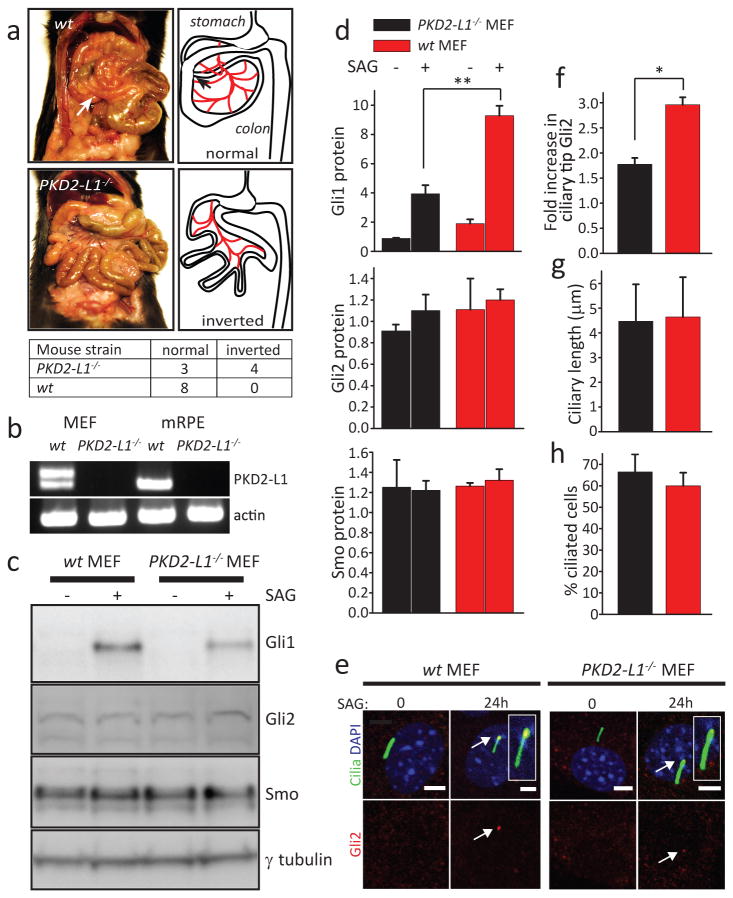
Primary cilia are solitary, non-motile extensions of the centriole found on nearly all nucleated eukaryotic cells between cell divisions. Only ∼200-300 nm in diameter and a few micrometres long, they are separated from the cytoplasm by the ciliary neck and basal body. Often called sensory cilia, they are thought to receive chemical and mechanical stimuli and initiate specific cellular signal transduction pathways. When activated by a ligand, hedgehog pathway proteins, such as GLI2 and smoothened (SMO), translocate from the cell into the cilium. Mutations in primary ciliary proteins are associated with severe developmental defects. The ionic conditions, permeability of the primary cilia membrane, and effectiveness of the diffusion barriers between the cilia and cell body are unknown. Here we show that cilia are a unique calcium compartment regulated by a heteromeric TRP channel, PKD1L1-PKD2L1, in mice and humans. In contrast to the hypothesis that polycystin (PKD) channels initiate changes in ciliary calcium that are conducted into the cytoplasm, we show that changes in ciliary calcium concentration occur without substantially altering global cytoplasmic calcium. PKD1L1-PKD2L1 acts as a ciliary calcium channel controlling ciliary calcium concentration and thereby modifying SMO-activated GLI2 translocation and GLI1 expression.


Figures

Extended Data Figure 1
Extended Data Figure 1. Arl13B-EGFP identifies primary and motile cilia in transgenic mouse tissue
Frozen tissue sections were prepared from (a-c) P0 intestine; (d-f) E15 nasal cavity; (g-i) 6-week-old hippocampus; (j-l) P0 retina from Arl13B-EGFPtg mice. First column, Arl13B-EGFPtg (green) fluorescence; second column (red) labels villin in b, adenylyl cyclase III (ACIII) in e, h, or HMB-45 (human melanoma black antibody, retinal pigmented epithelial cells) in k. a-c. Intestine: EGFP fluorescence in a does not overlap with the anti-villin staining in b as shown in the merged image in c, indicating that Arl13B-EGFP is absent from microvilli (arrows). Scale bar, 100 μm. d-f. Nasal cavity, (d) several Arl13B-EGFP-positive cilia (arrows) that face the lumen of the turbinate colocalize with ACIII (e) as shown in the merged image (f). Scale bar, 100 μm. Insert shows magnification of nasal cavity surface. Scale bar of inset in f, 5 μm. g-i. CA1 region of hippocampus: (g) Prominent cilia (arrows) overlap with ACIII staining (h) as shown in the merged image (i). Scale bar, 50 μm. Insert shows magnification of hippocampal cilia. Inset scale bar, 5 μm. Merged red and green channels were offset for clarity (inset). j-l. Retinal pigmented epithelia (RPE): (j) Short cilia (arrow) are visible at the intersection between RPE (labeled with HMB-45 antibody, (k) and developing photoreceptor cells, as shown in the merged image (l). Scale bar, 10 μm. Insert shows magnification of RPE/photoreceptor interface. Inset scale bar, 2 μm.
Extended Data Figure 2
Extended Data Figure 2. Arl13B-EGFP labels a primary cilium in cultured MEF and RPE cells
First column shows Arl13B-EGFPtg (green) fluorescence; second column labels ACIII (b, e) or (h, k) acetylated tubulin. Third column: merged red and green channels were offset for clarity. (a-c) Primary mouse embryonic fibroblasts (MEF) of Arl13B-EGFPtg and (d-f) wt mice isolated from E14.5 embryos. Arl13B-EGFP co-localizes with ciliary ACIII in c. MEFs isolated from wt mice show no fluorescence in the cilium (488 nm excitation). (g-i) Primary RPE cells isolated from P12 Arl13B-EGFPtg mice. Cells were fixed and stained with antibody to acetylated tubulin. Arl13B-EGFP (g) exclusively localized to the primary cilium identified by antibody to acetylated tubulin (h, i). (j-l) Stable cell line (hRPE1) expressing Smo-EGFP. After 2 days of serum starvation, Smo-EGFP labeled the primary cilium of hRPE1 cells (j) as indicated by acetylated tubulin labeling (k, l). Scale bar in c, f, i, l; 5 μm. (m, n) To determine whether Arl13B-EGFP expression adversely affected ciliogenesis, ciliary length and percent of cells with cilia were quantified from wt and Arl13B-EGFP-expressing MEFs stained by anti-acetylated tubulin. (m) Ciliary length was similar in wt and Arl13B-EGFP-expressing MEFs (2.6 ± 0.5 μm vs. 2.9 ± 0.8 μm, respectively, n=200). (n) The number of cells with cilia was also comparable between wt and Arl13B-EGFP-expressing MEFs (60.2% ± 5.1% vs. 65.5% ± 7.3%; n=120).
Extended Data Figure 3
Extended Data Figure 3. Ciliary [Ca2+] changes in stably-transfected RPE cell cilia
(a-c) Live hRPE1 cells stably expressing Smo-GCaMP3 were treated with 5 μM ionomycin. Fluorescence increases were measured in the cilium and cytoplasm. Image in (c) is DIC. (d) Changes in fluorescence (ΔF/F) of the calcium sensor, GCaMP3, are plotted for both cytoplasm and cilium. (e-h) hRPE1 cells expressing Smo-mCherry-GCaMP3 were stained with acetylated tubulin. GCaMP3 (e) and mCherry (f) fluorescence overlaps with acetylated tubulin staining (g, h). Scale bar, 5 μm; merged channels were offset for clarity. (i) The tip of a cilium was ruptured with an intense 1 s laser pulse (405 nm, hRPE1 cell expressing Smo-mCherry-GCaMP3). Circle indicates area of rupture. Numbered arrowheads indicate positions where changes in fluorescence were measured. Star (*) indicates mCherry fluorescence outside of cilium, indicating that some Smo-mCherry-GCaMP3 is retained in the ER. (j) Quantification of changes in fluorescence at the positions marked in i. Rupture of the ciliary membrane rapidly increases [Ca2+]cilia at the tip and travels along the cilium at 4.6 ± 0.6 μm/s (n=16).
Extended Data Figure 4
Extended Data Figure 4. [Ca2+]cilia calibration
(a) Images of hRPE1 cells stably expressing Smo-mCherry-GCaMP3 were acquired after permeabilisation with 15 μM digitonin in varying extracellular [Ca2+]. (b) Averages of several ratios (n = 12-16; ± S.D.) per concentration are plotted against free [Ca2+], yielding the calibration curve for Smo-mCherry-GCaMP3: KD = 625 nM.
Extended Data Figure 5
Extended Data Figure 5. Overexpressed and endogenous PKD2-L1 localizes to the primary cilium
(a-c) rabbit anti-PKD2-L1 (Thermo Scientific) recognizes overexpressed PKD2-L1. HEK cells were transfected with hPKD2-L1-IRES mCherry construct and stained with PKD2-L1 ab. PKD2-L1 staining (a) is specific to cells that also express mCherry (b). (c) overlay. (d-f) overexpressed hPKD2-L1 localizes to the primary cilium in mIMCD3 cells. mIMCD3 cells were transfected with HA-tagged hPKD2-L1 and stained with an anti-HA ab (d) and anti acetylated tubulin ab (e). HA immunoreactivity is visible both in the cytoplasm and cilium. (f) overlay (g-h) PKD2-L1 antibody labels the primary cilium of mIMCD3 cells. (g) Confluent mIMCD3 cells were stained with anti-PKD2-L1 ab used in a and (h) acetylated tubulin ab to label cilia. PKD2-L1 immunoreactivity is visible in the primary cilium. (i) overlay. (j-o) Primary mouse embryonic fibroblasts (MEF) of Arl13B-EGFPtg (j-l) and Arl13B-EGFPtg × PKD2-L1-/- mice (m-o) isolated from E14.5 embryos were stained with anti-PKD2-L1 ab used in (a). In Arl13B-EGFPtg MEF PKD2L1 immunoreactivity (j) colocalizes with Arl13B-EGFP signal (k) labeling the primary cilium. (l) overlay. (m-o) PKD2-L1 staining is absent in cilia of Arl13B-EGFPtg × PKD2L1-/- mice. Scale bars = 10 μm.
Extended Data Figure 6
Extended Data Figure 6. [Ca2+]cilia increases 24 h after SAG stimulation
(a) MEF cells expressing Arl13B-mCherry-GECO1.2 were stained with acetylated tubulin. GECO1.2 and mCherry fluorescence overlaps with acetylated tubulin staining. Scale bar, 5 μm; merged channels were offset for clarity. (b) Ratio maps of MEFs isolated from Arl13B-mCherry-GECO1.2 mice stimulated with 0.05% DMSO (left) or 400 nM SAG (right) for 24 h. Scale bar, 5 μm. (c) Quantification of ciliary GECO1.2 / mCherry ratios obtained for MEF cells with and without SAG stimulation. Ratio increases from 0.4 ± 0.05 to 0.8 ± 0.2 after SAG stimulation (*p<0.05; n=20-30 cilia). (d) Example ciliary current measured from MEFs treated with 500 nM SAG (Smo agonist) or with DMSO vehicle (0.05%) in culture for 24-36 h in control conditions and after activation with 10 μM calmidazolium (CMZ). (e) Scatter and whisker (± S.D.) plots from cilia show total outward (+100 mV) and inward (-100 mV) current measured for both treatment groups. Averages are indicated by the thick horizontal lines and individual cilium current magnitudes are represented as circles. P-values resulting from Student's t-test comparing treatment groups are indicated (*< 0.05; n = 11 cilia).
Figure 1
Figure 1. ArlGFP localizes to primary cilia and motile cilia in vivo
(a) Fixed paw of E14.5 embryo, and (b) after incubation in ScaleA2. Insert indicates area where z-stacks from 0 to 1.2 mm depth were acquired. Scale bar, 500 μm. (c) Arl13B-EGFP expression in E14.5 paw. 3 × 4 z-stacks were stitched together, depth color-coded and projected onto a plane. Scale bar, 200μm. (d-f) EGFP-positive cilia are present in fibroblasts within the digit (arrows) that overlap with ACIII labeling in e and merged in f. Scale bar = 10 μm; insert, 3 μm; asterisks indicate autofluorescence. Red and green channels are offset to visualize colocalization. (g-i) Motile cilia in the Fallopian tube express Arl13B-EGFP (g) that overlaps with acetylated tubulin (h). Overlay (i). Insert in (i) is DIC image. Scale bar, 5 μm.
Figure 2
Figure 2. Smo-mCherry-GCAMP3 localizes to the primary cilium and reports ciliary [Ca2+]. [Ca2+]cilia is poorly coupled to [Ca2+]cyto
(a) hRPE1 cells expressing Smo-mCherry-GCaMP3 were treated with 5 μM ionomycin and changes in fluorescence were measured in the cilium and cytoplasm. (b) Schematic of ratiometric calcium sensor and quantified fluorescence. (c, d) After rupture of the ciliary tip with a laser pulse (t = 10 s), [Ca2+]cilia rapidly increases, while [Ca2+]cyto near the base of the cilium (circle pos. 2)increases only slightly 40 s later (t = 60 s). Ionomycin added for normalization. Circles in (c) indicate areas where fluorescence was measured. (e) Distribution of lag times between ciliary and cytoplasmic [Ca2+] increases. (f) Calcium diffusion from the cytoplasm to the cilium is not restricted. Red dot indicates the position of calcium uncaging while the white line indicates length and position of line scan. Arrows indicate cytoplasm to cilium transition. Scale bar, 5 μm. See also Supplementary Video 6.
Figure 3
Figure 3. Resting cilium [Ca2+] is substantially higher than resting cytoplasmic [Ca2+]
(a) Live hRPE1 cell F GCaMP3/F mCherry ratios in 2mM [Ca2+]e in the cilium (top) and cytoplasm (bottom). Scale bar, 5 μm. (b) Plot of measured ciliary fluorescence ratio (avg. = 0.8 ± 0.12, n = 16 cilia) vs. estimated [Ca2+]cilia. Resting [Ca2+]cilia = 580 nM. (c) Plot of measured cytoplasmic fluorescence ratio (avg. = 0.28 ± 0.02, n = 20 cells) vs. estimated [Ca2+]cyto. Resting [Ca2+]cyto is 110 nM. (d) By measuring current amplitudes in perforated patches (Methods), we estimated resting free [Ca2+]cilia as 742 nM. Black circles = current at +100 mV; grey circles = current at -100 mV. (e) Changes in cell (Vm) and cilia (Vcilia) potentials in response to external [K+]. (f) Average potential of the cell body and cilia plotted as a function of external [K+]. Vm differs from Vcilia at all [K+] other than [K+]e = 145mM; p < 0.05). The measured resting membrane potential is -18 mV for the cilia and -53 mV for the cell (± SEM, n = 5 cells and 4 cilia). The grey dashed line is the K+ Nernst potential.
Figure 4
Figure 4. PKD2-L1-/- mice exhibit defects in Smo-mediated Gli1 activation
(a) Intestinal malrotation in PKD2-L1-/- mice, and comparison with wt. Arrow indicates correct rotation of intestine. Schematic orientation of intestines is on right, red = mesentery. (b) RT-PCR of MEF and mRPE-derived cDNAs shows that PKD2-L1 is expressed in both cell types. (c) Western blot of Gli1, Smo, Gli2, and γ-tubulin expression in wt and PKD2-L1-/- MEFs after stimulation for 24 h with 400 nM SAG. (d) upper panel: Gli1 in wt (1.9 ± 0.3 vs. 9.3 ± 0.7 after stimulation) and PKD2-L1-/- MEFs (0.9 ± 0.04 vs. 4.0 ± 0.6 after stimulation). p < 0.01. middle panel: Gli2 in wt (0.9 ± 0.1 vs. 1.1 ± 0.2 after stimulation) vs. PKD2-L1-/- MEFs (1.1 ± 0.3 vs. 1.2 ± 0.1 after stimulation). lower panel: Smo in wt (1.3 ± 0.3 vs. 1.2 ± 0.09 after stimulation) vs. PKD2-L1-/- MEFs (1.3 ± 0.04 vs. 1.3 ± 0.1 after stimulation; n = 3 wt embryos, 5 PKD2-L1-/- embryos). (e) Localization of Gli2 at the distal tip of Arl13B-EGFPtg and PKD2-L1-/- × Arl13B-EGFPtg MEF cilia. Scale bar, 5 μm. Arrows point to Gli2 at cilia tips. Cilia are magnified in inserts. (f) Quantitation of Gli2 protein accumulation at the ciliary tip after SAG stimulation; wt=3.0 ± 0.2 (n=40 cilia each from 3 embryos) vs. PKD2-L1-/- MEF = 1.8 ± 0.1 fold increase (n=40 cilia each from 5 embryos). p < 0.05. (g, h) quantification of ciliary length (4.5 ± 1.5μm for wt vs. 4.6 ± 1.6μm for PKD2-L1-/- MEFs) and percentage of ciliated cells (67 ± 8% for wt vs. 60 ± 6% for PKD2-L1-/- MEFs; n=40 cilia each from 3 embryos).

Comment in

  • Calcium: an ion channel for cilia.
    Du Toit A. Du Toit A. Nat Rev Mol Cell Biol. 2014 Feb;15(2):78. doi: 10.1038/nrm3736. Epub 2013 Dec 27. Nat Rev Mol Cell Biol. 2014. PMID: 24370826 No abstract available.

Similar articles

Cited by

References

    1. Corbit KC, et al. Vertebrate Smoothened functions at the primary cilium. Nature. 437:1018–1021. - PubMed
    1. Huangfu D, Anderson KV. Cilia and Hedgehog responsiveness in the mouse. Proc Natl Acad Sci U S A. 102:11325–11330. - PMC - PubMed
    1. Goetz SC, Anderson KV. The primary cilium: a signalling centre during vertebrate development. Nat Rev Genet. 11:331–344. - PMC - PubMed
    1. Praetorius HA, Spring KR. Bending the MDCK cell primary cilium increases intracellular calcium. J Membr Biol. 184:71–79. - PubMed
    1. DeCaen PG, Delling M, Vien TN, Clapham DE. Direct recording and identification of the calcium channel of primary cilia. Nature. xxxxxx. - PMC - PubMed

Publication types

MeSH terms