. 2014 Dec 11;33(50):5688-96.
doi: 10.1038/onc.2013.507. Epub 2013 Dec 2.

Mechanism of human PTEN localization revealed by heterologous expression in Dictyostelium

Affiliations

Mechanism of human PTEN localization revealed by heterologous expression in Dictyostelium

H N Nguyen et al. Oncogene. .

Abstract

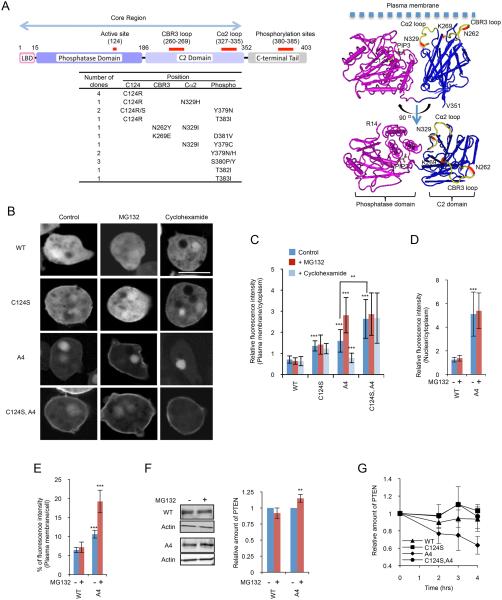
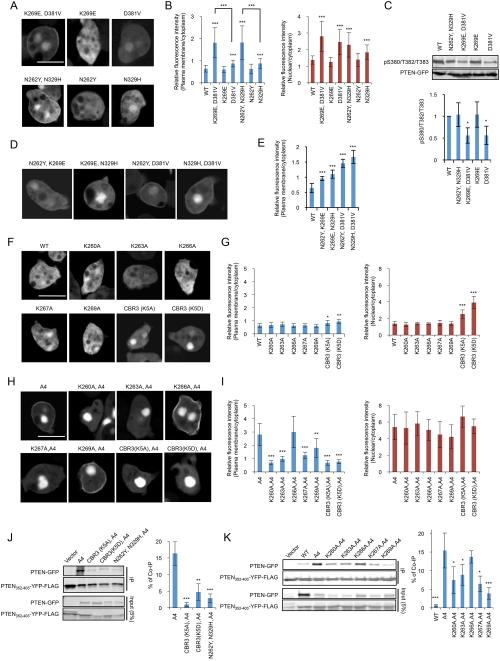
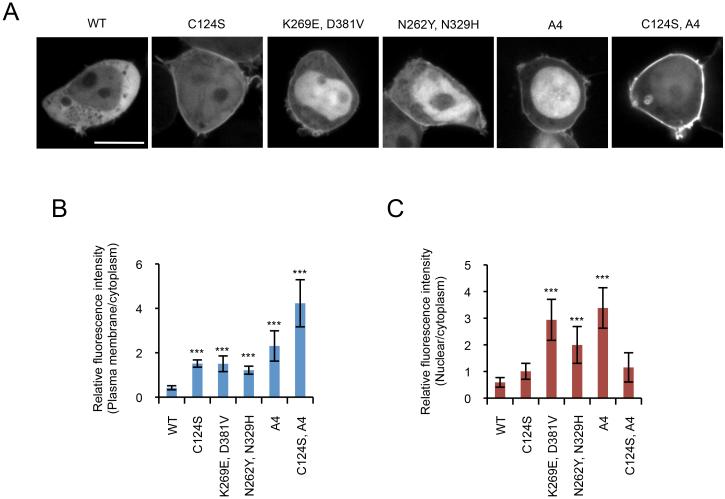
Phosphatase and tensin homolog (PTEN) is one of the most frequently mutated tumor suppressor genes in cancers. PTEN has a central role in phosphatidylinositol (3,4,5)-trisphosphate (PIP3) signaling and converts PIP3 to phosphatidylinositol (4,5)-bisphosphate at the plasma membrane. Despite its importance, the mechanism that mediates membrane localization of PTEN is poorly understood. Here, we generated a library that contains green fluorescent protein fused to randomly mutated human PTEN and expressed the library in Dictyostelium cells. Using live cell imaging, we identified mutations that enhance the association of PTEN with the plasma membrane. These mutations were located in four separate regions, including the phosphatase catalytic site, the calcium-binding region 3 (CBR3) loop, the Cα2 loop and the C-terminal tail phosphorylation site. The phosphatase catalytic site, the CBR3 loop and the Cα2 loop formed the membrane-binding regulatory interface and interacted with the inhibitory phosphorylated C-terminal tail. Furthermore, we showed that membrane recruitment of PTEN is required for PTEN function in cells. Thus, heterologous expression system in Dictyostelium cells provides mechanistic and functional insight into membrane localization of PTEN.


Figures

Figure 1
Figure 1. Isolated PTEN mutations
(A) The domain structure of PTEN is shown. The table summarizes the position and frequency of mutations isolated in the screen. The isolated mutations were indicated in the 3-D structure of PTEN with the phosphatase and C2 domains (R14-V351) (12) (http://www.ncbi.nlm.nih.gov/Structure/mmdb/mmdbsrv.cgi?uid=11638). (B) Dictyostelium cells expressing GFP fused to PTEN, PTENC124S, PTENA4, and PTENC124S,A4 were viewed by fluorescence microscopy. Cells were incubated in the presence or absence of 20 μM MG132 or 40 μg/ml cycloheximide. Bar, 10 μm. (C and D) Fluorescence intensity of GFP fused to WT or the indicated PTEN mutant at the plasma membrane (C) or nucleus (D) was quantified relative to that in the cytosol as described in Materials and Methods. Values represent the mean ± SD (n ≥ 15). (E) Integrated fluorescence intensity of PTEN-GFP and PTENA4-GFP at the plasma membrane was normalized relative to total fluorescence intensity in cells (n ≥ 10). (F) Whole-cell lysates prepared from cells expressing PTEN-GFP or PTENA4-GFP were analyzed by immunoblotting with antibodies against GFP and actin in the presence or absence of MG132. Band intensity was quantified (n = 3). (G) Cells expressing GFP fused to the indicated forms of PTEN were incubated with 40 μg/ml cycloheximide. Whole-cell lysates were analyzed by immunoblotting with anti-GFP antibodies at the indicated time points. Band intensity was quantified relative to 0 hour sample (n = 3).
Figure 2
Figure 2. Analysis of PTENC124S
(A) Dictyostelium cells expressing GFP fused to PTEN, PTENA4, PTENR130G, PTENR130G, A4, and PTENC71S were incubated with 20 μM MG132 for 6 hour and viewed by fluorescence microscopy. Bar, 10 μm. (B) Fluorescence intensity at the plasma membrane was quantified (n ≥ 15). (C and D) WT and PTEN-null cells expressing PTEN-GFP, PTENC124S-GFP or PHcrac-GFP were observed by fluorescence microscopy in the presence or absence of 20 μM LY294002. Fluorescence intensity of PTENC124S-GFP at the plasma membrane was quantified (D). Values represent the mean ± SD (n ≥ 15). (E-G) Interaction of the C-terminal tail domain of PTEN with full length PTEN was assessed by pull-down assay. Whole-cell lysates expressing PTEN-GFP, PTENC124S,A4-GFP, or PTENR130G,A4-GFP were incubated with PTEN352–403-YFP-FLAG. Introducing the A4 mutation into full length PTEN allowed to examine interactions of the core region of PTENA4 and the C-terminal tail, as shown in (E). PTEN352–403-YFP-FLAG was immunoprecipitated with beads coupled to anti-FLAG antibodies. Bound fractions (immunoprecipitates, IP) were analyzed with antibodies to GFP and FLAG. (G) Band intensity was quantified (n = 3).
Figure 3
Figure 3. Mutational analysis of the C-terminal phosphorylation sites of PTEN
(A-C) Dictyostelium cells expressing GFP fused to the indicated version of PTEN were observed by fluorescence microscopy in the presence of 20 μM MG132 (A). Bar, 10 μm. GFP intensities at the plasma membrane (B) and nucleus (C) were determined relative to that in the cytosol. Values represent the mean ± SD (n ≥ 15). The mutations isolated from our screen are shown in red. (D) Whole-cell lysates expressing the indicated forms of PTEN-GFP were analyzed by immunoblotting with antibodies against phospho-PTEN (pS380/T382/T383) and GFP (PTEN-GFP). Band intensity was quantified (n ≥ 3).
Figure 4
Figure 4. The CBR3 and Cα2 loops are important for interactions with the plasma membrane and the C-terminal tail
(A and B) Dictyostelium cells expressing the indicated forms of PTEN-GFP were viewed by fluorescence microscopy in the presence of 20 μM MG132 (A). Intensities of GFP signals at the plasma membrane and nucleus were quantified relative to that in the cytosol (B). Bar, 10 μm. (C) Whole-cell lysates expressing GFP fused to different forms of PTEN were analyzed by immunoblotting with antibodies against phospho-PTEN (pS380/T382/T383) and GFP (PTEN-GFP). Band intensity was quantified (n ≥ 3).(D and E) Cells expressing the indicated versions of PTEN-GFP were examined in the presence of 20 μM MG132 (D). Fluorescence intensity of GFP at the plasma membrane was quantified (E). Values represent the mean ± SD (n ≥ 15). (F and G) GFP fused to PTEN with the indicated mutations in the CBR3 loop were expressed in Dictyostelium cells in the presence of 10 μM MG132 (F). Relative GFP signals at the plasma membrane and nucleus were determined relative to that in the cytosol (G). (H and I) GFP fused to PTENA4 with the indicated CBR3 loop mutations were expressed in Dictyostelium cells in the presence of 20 μM MG132 (H). Relative GFP signals at the plasma membrane and nucleus were determined relative to that in the cytosol (I). (J and K) Interaction of the C-terminal domain of PTEN carrying mutations in the CBR3 and Cα2 loops with its N-terminal core region was assessed in pull-down assays. PTEN352–403-YFP-FLAG was added to whole-cell lysates expressing the indicated PTEN-GFP constructs and immunoprecipitated with beads coupled to anti-FLAG antibodies. Bound fractions (IP) were analyzed with antibodies to GFP and FLAG. Band intensity was quantified (n = 3).
Figure 5
Figure 5. PTEN requires membrane association and phosphatase activity for its function
(A) The indicated PTEN-GFP proteins were immunopurified from Dictyostelium cells, and phosphatase activities were measured (n ≥ 3). (B and C) PTEN-null Dictyostelium cells expressing different PTEN-GFP constructs were starved to induce differentiation into fruiting bodies. Pictures were taken at 36 hours (B) and 18 and 22 hours (C) after the onset of starvation. While PTEN-null cells expressing PTEN (WT) formed fruiting bodies, PTEN-null cells expressing a vector alone did not aggregate and remained undifferentiated (B). Inserts show side views of fruiting bodies (B).
Figure 6
Figure 6. Localization of GFP-PTEN in HEK293T cells
HEK293T cells expressing the indicated forms of PTEN-GFP were viewed by fluorescence microscopy (A). (B and C) Intensities of GFP signals at the plasma membrane (B) and nucleus (C) were quantified relative to that in the cytosol (B). Bar, 10 μm.
Figure 7
Figure 7. Model for mechanisms of PTEN membrane localization
Positively-charged lysine residues (K260, K263, and K269) in the CBR3 loop are masked by phosphorylated serine (S380) and threonine (T383) in the C-terminal tail. PTEN adopts an open conformation upon dephosphorylation of the tail, and the two lysine residues interact with negatively-charged phospholipids in the plasma membrane. Proteasome-mediated degradation of PTEN occurs rapidly at the plasma membrane and is dependent upon the phosphatase activity of PTEN. The open conformation of dephosphorylated PTEN would also expose an otherwise hidden nuclear localization signal to promote nuclear import of PTEN.

Similar articles

Cited by

References

    1. Hollander MC, Blumenthal GM, Dennis PA. PTEN loss in the continuum of common cancers, rare syndromes and mouse models. Nat Rev Cancer. 2011;11(4):289–301. Epub 2011/03/25. - PMC - PubMed
    1. Carracedo A, Alimonti A, Pandolfi PP. PTEN level in tumor suppression: how much is too little? Cancer Res. 2011;71(3):629–33. Epub 2011/01/27. - PMC - PubMed
    1. Leslie NR, Dixon MJ, Schenning M, Gray A, Batty IH. Distinct inactivation of PI3K signalling by PTEN and 5-phosphatases. Adv Biol Regul. 2012;52(1):205–13. Epub 2011/09/21. - PubMed
    1. Rodon J, Dienstmann R, Serra V, Tabernero J. Development of PI3K inhibitors: lessons learned from early clinical trials. Nat Rev Clin Oncol. 2013;10(3):143–53. Epub 2013/02/13. - PubMed
    1. Vanhaesebroeck B, Stephens L, Hawkins P. PI3K signalling: the path to discovery and understanding. Nature reviews Molecular cell biology. 2012;13(3):195–203. Epub 2012/02/24. - PubMed

Publication types

MeSH terms