. 2013 Nov 25;14(12):23212-30.
doi: 10.3390/ijms141223212.

Blocking autophagic flux enhances matrine-induced apoptosis in human hepatoma cells

Affiliations

Blocking autophagic flux enhances matrine-induced apoptosis in human hepatoma cells

Li Wang et al. Int J Mol Sci. .

Abstract

Autophagy, a self-defense mechanism, has been found to be associated with drug resistance in hepatocellular carcinoma (HCC). Our study was designed to investigate the role and related mechanisms of autophagy in matrine-induced apoptosis in hepatoma cells of HepG2 and Bel7402. Cell apoptosis was detected by flow cytometry analysis (Annexin V-FITC/PI double-staining assay), the activity and activating cleavages of caspase-3, -8, and -9. MTT assay and colony forming assay were used to assess the effect of matrine on growth and proliferation of HCC cells. Autophagic flux in HCC cells was analyzed using the expression of LC3BI/II and p62/SQSTM1, GFP-LC3 transfection, and transmission electron microscopy. Moreover, regarding to the associated mechanisms, the effects of matrine on the phosphoinositide 3-kinase/AKT/mTOR pathway and beclin-1 were studied. Our results showed that: (1) both autophagy and apoptosis could be induced by treatment with matrine; (2) using the autophagic inhibitor chloroquine and beclin-1 small-interfering RNA, cell apoptosis induced by matrine could be enhanced in a caspase-dependent manner; and (3) autophagy was induced via inhibition of PI3K/AKT/mTOR pathway and up-regulation of beclin-1. In conclusion, inhibition of autophagy could enhance matrine-induced apoptosis in human hepatoma cells.


Figures

Figure 1.
Figure 1.
MTT assay showing the cytotoxicity of matrine or CQ on HCC cells. (a) HepG2 and (b) Bel7402 cells were treated with matrine at concentrations of 0.2, 0.4, 0.8, 1.2, 1.6, and 3.2 mg/mL for 24, 48, and 72 h. Matrine inhibited the growth of HepG2 and Bel7402 cells in a dose- and time-dependent manner. The optimal concentration was determined by the half maximal inhibitory concentration calculated using GraphPad software; (c) HepG2 and (d) Bel7402 cells were also treated with CQ at concentrations of 7.8, 15.6, 31.2, and 46.9 μM for 48 h. Data are means ± SD of three independent experiments. *p < 0.05, **p < 0.01,***p < 0.001 vs. control group.
Figure 2.
Figure 2.
The suppressive effect of matrine with or without CQ on colony formation of hepG2 and Bel7402 cells. (a) Representative images of colony-forming assay; (b) Analysis of Colony formation rates of hepG2 and Bel7402 cells. Data are means ± SD of three independent experiments. *p < 0.05 vs. control group, #p < 0.05 vs. matrine group.
Figure 3.
Figure 3.
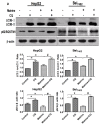
CQ inhibited matrine-induced autophagic flux in HepG2 and Bel7402 cells. HepG2 and Bel7402 cells were treated with 0.8 mg/mL matrine in the absence or presence of CQ (7.8 μM) for 48 h. (a) Western blot analysis of expression of the LC3BII/LC3BI ratio and p62/SQSTM1. β-actin is shown as a loading control; (b) Representative confocal images after transfection with GFP-LC3 and staining with LysoTracker Red. The positive GFP-LC3 puncta represent the formation of autophagosomes. The quantification of LC3-positive autophagosomes and lysosomes labeled with LysoTracker Red in HepG2 and Bel7402 cells were performed using Image J. Nuclei were stained with DAPI (blue). Scale bars, 10 μm; (c) Representative transmission electron micrograph of HepG2 and Bel7402 cells treated with matrine (0.8 mg/mL for 48 h): (i,v) Control cells without matrine; (iiiv,viviii) Cells treated with matrine; Abundant autophagic vacuoles were observed after treatment with matrine in (ii) and (vi); Typical autophagic vacuoles are magnified in (iv) and (viii); Autophagosomes (early autophagic compartments; black arrowheads) are double-membrane structures that engulf cellular contents, while autolysosomes (late autophagic compartments; black arrows) are single-membrane structures containing degraded cellular contents. Typical apoptotic changes such as chromatin condensation, nuclear fragmentation, and apoptotic bodies are indicated with white arrows in (iii) and (vii). N, nucleus. Scale bars, 1 μm (iiii, vvii) and 0.5 μm (iv, viii). Data are means ± SD of three independent experiments. *p < 0.05 vs. control group, #p < 0.05 vs. matrine group.
Figure 3.
Figure 3.
CQ inhibited matrine-induced autophagic flux in HepG2 and Bel7402 cells. HepG2 and Bel7402 cells were treated with 0.8 mg/mL matrine in the absence or presence of CQ (7.8 μM) for 48 h. (a) Western blot analysis of expression of the LC3BII/LC3BI ratio and p62/SQSTM1. β-actin is shown as a loading control; (b) Representative confocal images after transfection with GFP-LC3 and staining with LysoTracker Red. The positive GFP-LC3 puncta represent the formation of autophagosomes. The quantification of LC3-positive autophagosomes and lysosomes labeled with LysoTracker Red in HepG2 and Bel7402 cells were performed using Image J. Nuclei were stained with DAPI (blue). Scale bars, 10 μm; (c) Representative transmission electron micrograph of HepG2 and Bel7402 cells treated with matrine (0.8 mg/mL for 48 h): (i,v) Control cells without matrine; (iiiv,viviii) Cells treated with matrine; Abundant autophagic vacuoles were observed after treatment with matrine in (ii) and (vi); Typical autophagic vacuoles are magnified in (iv) and (viii); Autophagosomes (early autophagic compartments; black arrowheads) are double-membrane structures that engulf cellular contents, while autolysosomes (late autophagic compartments; black arrows) are single-membrane structures containing degraded cellular contents. Typical apoptotic changes such as chromatin condensation, nuclear fragmentation, and apoptotic bodies are indicated with white arrows in (iii) and (vii). N, nucleus. Scale bars, 1 μm (iiii, vvii) and 0.5 μm (iv, viii). Data are means ± SD of three independent experiments. *p < 0.05 vs. control group, #p < 0.05 vs. matrine group.
Figure 4.
Figure 4.
Combined treatment with the autophagic inhibitor CQ promoted matrine-induced apoptosis. (a) HepG2 and Bel7402 cells were treated with matrine 0.8 mg/mL in the absence or presence of CQ (7.8 μM) for 48 h. Annexin V-FITC and PI double-staining shows the percentages of early (bottom right) and late (top right) apoptotic cells; (b) Analysis of the total percentage of early and late apoptotic cells in different groups; (c) Western blot analysis of activated caspase-3, -8, and -9 expression in HepG2 and Bel7402 cells treated with 0.8 mg/mL matrine in the absence or presence of CQ (7.8 μM) for 48 h. β-Actin is shown as a loading control; (d) Analysis of relative expression of activated caspase-3, -8, and -9; (e) Activity of caspase-3, -8, -9 in HepG2 and Bel7402 cells after treated with matrine 0.8 mg/mL in the absence or presence of CQ. Data are from three independent experiments. *p < 0.05 vs. control group, #p < 0.05 vs. matrine-treated group.
Figure 4.
Figure 4.
Combined treatment with the autophagic inhibitor CQ promoted matrine-induced apoptosis. (a) HepG2 and Bel7402 cells were treated with matrine 0.8 mg/mL in the absence or presence of CQ (7.8 μM) for 48 h. Annexin V-FITC and PI double-staining shows the percentages of early (bottom right) and late (top right) apoptotic cells; (b) Analysis of the total percentage of early and late apoptotic cells in different groups; (c) Western blot analysis of activated caspase-3, -8, and -9 expression in HepG2 and Bel7402 cells treated with 0.8 mg/mL matrine in the absence or presence of CQ (7.8 μM) for 48 h. β-Actin is shown as a loading control; (d) Analysis of relative expression of activated caspase-3, -8, and -9; (e) Activity of caspase-3, -8, -9 in HepG2 and Bel7402 cells after treated with matrine 0.8 mg/mL in the absence or presence of CQ. Data are from three independent experiments. *p < 0.05 vs. control group, #p < 0.05 vs. matrine-treated group.
Figure 5.
Figure 5.
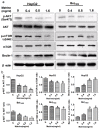
PI3K/AKT/mTOR signaling and beclin-1 are involved in matrine-induced autophagy. (a) Western blot analysis of pAKT, total AKT, p-mTOR, total mTOR, and beclin-1 in HepG2 and Bel7402 cells. β-actin is shown as a loading control. Data are from three independent experiments; (b) Analysis of relative expression of pAKT, total AKT, p-mTOR, total mTOR, and beclin-1. *p < 0.05 vs. control group.
Figure 6.
Figure 6.
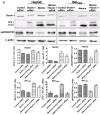
Effects of beclin-1 knockdown on matrine-induced autophagic flux and apoptosis in HepG2 and Bel7402 cells. (a) Beclin-1 expression, the LC3BII/LC3BI ratio and p62/SQSTM1 in HepG2 and Bel7402 cells after transfection with beclin-1 siRNA were detected by western blot. β-actin is shown as a loading control; (b) Representative confocal images of beclin-1-deficient cells after transfection with GFP-LC3 and treatment with matrine. LC3-positive autophagosomes in HCC cells were quantified using Image J (1.42q, NIH, Bethesda, MD, USA, 2009). Scale bars, 10 μm; (c) Apoptosis of HepG2 and Bel7402 cells transfected with beclin-1 siRNA after treatment with matrine was detected by Annexin V-FITC and PI double-staining. Apoptotic cell death was analyzed by the total percentage of early and late apoptotic cells in different groups. Data are means ± SD of three independent experiments. *p < 0.05 vs. control group, #p < 0.05 vs. matrine group.
Figure 6.
Figure 6.
Effects of beclin-1 knockdown on matrine-induced autophagic flux and apoptosis in HepG2 and Bel7402 cells. (a) Beclin-1 expression, the LC3BII/LC3BI ratio and p62/SQSTM1 in HepG2 and Bel7402 cells after transfection with beclin-1 siRNA were detected by western blot. β-actin is shown as a loading control; (b) Representative confocal images of beclin-1-deficient cells after transfection with GFP-LC3 and treatment with matrine. LC3-positive autophagosomes in HCC cells were quantified using Image J (1.42q, NIH, Bethesda, MD, USA, 2009). Scale bars, 10 μm; (c) Apoptosis of HepG2 and Bel7402 cells transfected with beclin-1 siRNA after treatment with matrine was detected by Annexin V-FITC and PI double-staining. Apoptotic cell death was analyzed by the total percentage of early and late apoptotic cells in different groups. Data are means ± SD of three independent experiments. *p < 0.05 vs. control group, #p < 0.05 vs. matrine group.

Similar articles

Cited by

References

    1. Chen W.Q., Zheng R.S., Zhang S.W. Liver cancer incidence and mortality in China, 2009. Chin. J. Cancer. 2013;32:162–169. - PMC - PubMed
    1. Llovet J.M., Bruix J. Systematic review of randomized trials for unresectable hepatocellular carcinoma: Chemoembolization improves survival. Hepatology. 2003;37:429–442. - PubMed
    1. El-Serag H.B., Siegel A.B., Davila J.A., Shaib Y.H., Cayton-Woody M., McBride R., McGlynn K.A. Treatment and outcomes of treating of hepatocellular carcinoma among medicare recipients in the United States: A population-based study. J. Hepatol. 2006;44:158–166. - PubMed
    1. Samuel M., Chow P.K., Chan S.E., Machin D., Soo K.C. Neoadjuvant and adjuvant therapy for surgical resection of hepatocellular carcinoma. Cochrane Database Syst. Rev. 2009 doi: 10.1002/14651858.CD001199.pub2. - DOI - PMC - PubMed
    1. Davila J.A., Duan Z., McGlynn K.A., El-Serag H.B. Utilization and outcomes of palliative therapy for hepatocellular carcinoma: A population-based study in the United States. J. Clin. Gastroenterol. 2012;46:71–77. - PMC - PubMed

Publication types

MeSH terms

LinkOut - more resources