Transcription through enhancers suppresses their activity in Drosophila
- PMID: 24279291
- PMCID: PMC3852481
- DOI: 10.1186/1756-8935-6-31
Transcription through enhancers suppresses their activity in Drosophila
Abstract
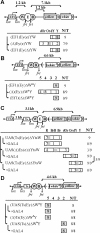
Background: Enhancer elements determine the level of target gene transcription in a tissue-specific manner, providing for individual patterns of gene expression in different cells. Knowledge of the mechanisms controlling enhancer action is crucial for understanding global regulation of transcription. In particular, enhancers are often localized within transcribed regions of the genome. A number of experiments suggest that transcription can have both positive and negative effects on regulatory elements. In this study, we performed direct tests for the effect of transcription on enhancer activity.
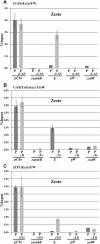
Results: Using a transgenic reporter system, we investigated the relationship between the presence of pass-through transcription and the activity of Drosophila enhancers controlling the expression of the white and yellow genes. The results show that transcription from different promoters affects the activity of enhancers, counteracting their ability to activate the target genes. As expected, the presence of a transcriptional terminator between the inhibiting promoter and the affected enhancer strongly reduces the suppression. Moreover, transcription leads to dislodging of the Zeste protein that is responsible for the enhancer-dependent regulation of the white gene, suggesting a 'transcription interference' mechanism for this regulation.
Conclusions: Our findings suggest a role for pass-through transcription in negative regulation of enhancer activity.
Figures


Similar articles
-
Zeste can facilitate long-range enhancer-promoter communication and insulator bypass in Drosophila melanogaster.Chromosoma. 2009 Oct;118(5):665-74. doi: 10.1007/s00412-009-0226-4. Epub 2009 Jul 4. Chromosoma. 2009. PMID: 19578867
-
The degree of enhancer or promoter activity is reflected by the levels and directionality of eRNA transcription.Genes Dev. 2018 Jan 1;32(1):42-57. doi: 10.1101/gad.308619.117. Epub 2018 Jan 29. Genes Dev. 2018. PMID: 29378788 Free PMC article.
-
Red Light/Green Light, a Dual Fluorescent Protein Reporter System To Study Enhancer-Promoter Specificity in Drosophila.G3 (Bethesda). 2020 Mar 5;10(3):985-997. doi: 10.1534/g3.119.401033. G3 (Bethesda). 2020. PMID: 31900331 Free PMC article.
-
Transcriptional regulation of the human apolipoprotein genes.Front Biosci. 2001 Mar 1;6:D456-504. doi: 10.2741/zannis. Front Biosci. 2001. PMID: 11229886 Review.
-
Diversity and Emerging Roles of Enhancer RNA in Regulation of Gene Expression and Cell Fate.Front Cell Dev Biol. 2020 Jan 14;7:377. doi: 10.3389/fcell.2019.00377. eCollection 2019. Front Cell Dev Biol. 2020. PMID: 31993419 Free PMC article. Review.
Cited by
-
Boundaries potentiate polycomb response element-mediated silencing.BMC Biol. 2021 Jun 2;19(1):113. doi: 10.1186/s12915-021-01047-8. BMC Biol. 2021. PMID: 34078365 Free PMC article.
-
Role of Transcriptional Read-Through in PRE Activity in Drosophila melanogaster.Acta Naturae. 2016 Apr-Jun;8(2):79-86. Acta Naturae. 2016. PMID: 27446595 Free PMC article.
-
Transcriptional Readthrough Interrupts Boundary Function in Drosophila.Int J Mol Sci. 2023 Jul 12;24(14):11368. doi: 10.3390/ijms241411368. Int J Mol Sci. 2023. PMID: 37511131 Free PMC article.
-
Comparative interactome analysis of the PRE DNA-binding factors: purification of the Combgap-, Zeste-, Psq-, and Adf1-associated proteins.Cell Mol Life Sci. 2022 Jun 9;79(7):353. doi: 10.1007/s00018-022-04383-2. Cell Mol Life Sci. 2022. PMID: 35676368 Free PMC article.
-
A Model System in S2 Cells to Test the Functional Activities of Drosophila Insulators.Acta Naturae. 2015 Oct-Dec;7(4):97-106. Acta Naturae. 2015. PMID: 26798496 Free PMC article.
References
-
- Kapranov P, Cheng J, Dike S, Nix DA, Duttagupta R, Willingham AT, Stadler PF, Hertel J, Hackermüller J, Hofacker IL, Bell I, Cheung E, Drenkow J, Dumais E, Patel S, Helt G, Ganesh M, Ghosh S, Piccolboni A, Sementchenko V, Tammana H, Gingeras TR. RNA maps reveal new RNA classes and a possible function for pervasive transcription. Science. 2007;316:1484–1488. doi: 10.1126/science.1138341. - DOI - PubMed
-
- Cheng J, Kapranov P, Drenkow J, Dike S, Brubaker S, Patel S, Long J, Stern D, Tammana H, Helt G, Sementchenko V, Piccolboni A, Bekiranov S, Bailey DK, Ganesh M, Ghosh S, Bell I, Gerhard DS, Gingeras TR. Transcriptional maps of 10 human chromosomes at 5-nucleotide resolution. Science. 2005;308:1149–1154. doi: 10.1126/science.1108625. - DOI - PubMed
LinkOut - more resources
Full Text Sources
Other Literature Sources
Molecular Biology Databases
Research Materials
Miscellaneous

