. 2014 Mar;92(3):277-90.
doi: 10.1007/s00109-013-1105-2. Epub 2013 Nov 26.

Both GLS silencing and GLS2 overexpression synergize with oxidative stress against proliferation of glioma cells

Affiliations

Both GLS silencing and GLS2 overexpression synergize with oxidative stress against proliferation of glioma cells

Mercedes Martín-Rufián et al. J Mol Med (Berl). 2014 Mar.

Abstract

Mitochondrial glutaminase (GA) plays an essential role in cancer cell metabolism, contributing to biosynthesis, bioenergetics, and redox balance. Humans contain several GA isozymes encoded by the GLS and GLS2 genes, but the specific roles of each in cancer metabolism are still unclear. In this study, glioma SFxL and LN229 cells with silenced isoenzyme glutaminase KGA (encoded by GLS) showed lower survival ratios and a reduced GSH-dependent antioxidant capacity. These GLS-silenced cells also demonstrated induction of apoptosis indicated by enhanced annexin V binding capacity and caspase 3 activity. GLS silencing was associated with decreased mitochondrial membrane potential (ΔΨm) (JC-1 dye test), indicating that apoptosis was mediated by mitochondrial dysfunction. Similar observations were made in T98 glioma cells overexpressing glutaminase isoenzyme GAB, encoded by GLS2, though some characteristics (GSH/GSSG ratio) were different in the differently treated cell lines. Thus, control of GA isoenzyme expression may prove to be a key tool to alter both metabolic and oxidative stress in cancer therapy. Interestingly, reactive oxygen species (ROS) generation by treatment with oxidizing agents: arsenic trioxide or hydrogen peroxide, synergizes with either KGA silencing or GAB overexpression to suppress malignant properties of glioma cells, including the reduction of cellular motility. Of note, negative modulation of GLS isoforms or GAB overexpression evoked lower c-myc and bcl-2 expression, as well as higher pro-apoptotic bid expression. Combination of modulation of GA expression and treatment with oxidizing agents may become a therapeutic strategy for intractable cancers and provides a multi-angle evaluation system for anti-glioma pre-clinical investigations.

Key message: Silencing GLS or overexpressing GLS2 induces growth inhibition in glioma cell lines. Inhibition is synergistically enhanced after arsenic trioxide (ATO) or H2O2 treatment. Glutatione levels decrease in GLS-silenced cells but augment if GLS2 is overexpressed. ROS synergistically inhibit cell migration by GLS silencing or GLS2 overexpression. c-myc, bid, and bcl-2 mediate apoptosis resulting from GLS silencing or GLS2 overexpression.


Conflict of interest statement

Conflict of interest The authors declare no conflict of interests related to this study.

Figures

Fig. 1
Fig. 1
Expression of GLS and GLS2 in assayed cell lines. Western blots show that SFxL and LN229 GLS silenced cell lines diminished GLS expression, and T98G-GAB cell line effectively overexpressed GLS2 isoform. Transacted controls were equivalent to non-transfected cells for all type of cells. Data are from one of three representative experiments. Glyceraldehyde-3-phosphate dehydrogenase (GAPDH) was used as loading control.
Fig. 2
Fig. 2
Effect of GLS silencing or GLS2 overexpression on the proliferation of glioma cells after 24 h without treatment. Proliferation of SFxL-GLS(−) and LN229-GLS(−) versus SFxL and LN229 cells, and T98G-GAB versus T98G cells, respectively, were assayed by MTS method. White bars for SFxL and LN229 cells represent cells transfected with a non-silencing shRNA. For T98G white bar represent value for wild type cells. Dark grey bars represent values for GLS-silenced cells, or cells overexpressing GLS2. Light gray bars represent values for transacted control (T98G-pcDNA cell line). Data are presented as the mean ± S.E. of triplicate experiments. Value for each control cell type was set at 100%. Differences were always significant (n = 3, *P< 0.01) between SFxL-GLS(−), LN229-GLS(−) or T98G-GAB cells and their respective control cells. Transacted controls were equivalent to non-transfected cells for all type of cells. Three asterisks indicated significantly different values between T98G-GAB cells and T98G-pcDNA cells (***P < 0.01)
Fig. 3
Fig. 3
Dose-dependent decrease in cell viability of the assayed glioma cell lines by MTS method after treatment with ATO or H2O2. a Bar chart showing percentages of survival in SFxL (white bars) and SFxL-GLS(−) (gray bars) cells when treated with 1.25–20 μM ATO for 24, 48 and 72 h. b Bar chart showing percentages of survival in SFxL (white bars) and SFxL-GLS(−) (gray bars) cells when treated with 50–300 μM H2O2 for 15 min, 1 and 6 h. c Bar chart showing percentages of survival in LN229 (white bars) and LN229-GLS(−) (gray bars) cells when treated with 1.25–20 μM ATO for 24, 48 and 72 h. d Bar chart showing percentages of survival in LN229 (white bars) and LN229-GLS(−) (gray bars) cells when treated with 50–300 μM H2O2 for 15 min, 1 and 6 h. e Bar chart showing percentages of survival in T98G (white bars) and T98G-GAB (gray bars) cells when treated with 10–50 μM ATO for 24, 48 and 72 h. f Bar chart showing percentages of survival in T98G (white bars) and T98G-GAB (gray bars) cells when treated with 50–300 μM H2O2 for 15 min, 1 and 6 h. Each value is mean from three independent experiments. Error bars are not shown in this figure for clarity. Transfected controls were equivalent to non-transfected cells for all type of cells. Asterisks indicated significantly decreased values between SFxL-GLS(−), LN229-GLS(−) or T98G-GAB cells and their respective control cells (* P< 0.05, ** P< 0.01). Three asterisks indicated significantly increased values between T98G-GAB cells and their respective control cells (*** P< 0.05)
Fig. 4
Fig. 4
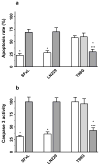
Assessment of apoptosis. Color code for bars as depicted in Fig. 2. a Apoptosis assay using cytometry after staining with annexin V-PE/propidium iodide (PI). b Caspase 3 activity using a fluorimetric assay as described in the materials and methods. Results are expressed as percentage of relative fluorescence units (RFU) per min per mg of protein detected in untreated cells, which are arbitrarily expressed as 100%. SFxL and LN229 cells were treated with 5 μM ATO (48 h), and T98G cells were treated with 50 μM ATO (48 h). For SFxL and LN229 pair cells caspase activity of GLS-silenced cells were set at 100%. Conversely, for T98G cell type cells caspase activity was set at 100% for wild type T98G. Data are presented as the mean ± S.E. of triplicate experiments. Differences were always significant (n = 3, *P< 0.01) between SFxL-GLS(−), LN229-GLS(−) or T98G-GAB cells and their respective control cells. Transacted controls were equivalent to non-transfected cells for all type of cells. Three asterisks indicated significantly different values between treated T98G-GAB cells and treated T98G-pcDNA cells (***P< 0.01)
Fig. 5
Fig. 5
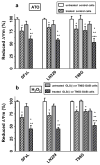
Flow cytometry analysis showing alterations in the ΔΨm of SFxL, LN229 and T98G cells. Upon completion of treatments, the cells were stained with JC-1 and the alterations in ΔΨm were analyzed as mentioned in methods. White bars represent non-silencing controls for SFxL and LN229 cells, as well as non-transfected controls for T98G cell line. Transfected controls were equivalent to non-transfected cells for all type of cells. Dark grey bars represent values for GLS-silenced cells, or cells overexpressing GLS2. Light gray bars represent values for control T98G-pcDNA cell line. Non-hatched bars represent untreated cells. Hatched bars represent treated cells with ATO (panel a) or H2O2 (panel b). a Bar chart showing percentages of relative fluorescence intensity of ΔΨm in SFxL versus SFxL-GLS(−) cells, LN229 versus LN229-GLS(−) cells, and T98G and T98G-pcDNA versus T98G-GAB cells for untreated (unfilled pattern) and 2.5 μM (SFxL and LN229 derivative cells) or 5 μM (T98G derivative cells) ATO (48 h) treated cells (angular stripes pattern). b Bar chart showing percentages of relative fluorescence intensity of ΔΨm in SFxL versus SFxL-GLS(−) cells, LN229 versus LN229-GLS(−) cells, and T98G and T98G-pcDNA versus T98G-GAB cells for untreated (unfilled pattern) and 200 μM H2O2 (1 h) treated cells (angular stripes pattern). Each value is mean ± S.E. from at least three independent experiments. Asterisk indicated significantly different values between treated and control (untreated) cells (*P< 0.01). Two asterisks indicated significantly different values between treated silenced/overexpressed cells and treated control cells (**P< 0.01). Three asterisks indicated significantly different values between treated T98G-GAB cells and treated T98G-pcDNA cells (***P< 0.01)
Fig. 6
Fig. 6
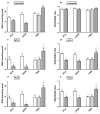
Glutathione levels (nmol/mg protein) were measured in pooled control or GLS-silenced/GLS2-transfected cells. Color code for bars as depicted in Fig. 2. a GSH levels in SFxL-GLS(−), LN229-GLS(−) and T98G-GAB cells versus SFxL, LN229 and T98G/T98G-pcDNA cells, respectively. b GSH/GSSG ratios in SFxL-GLS(−), LN229-GLS(−) and T98G-GAB cells versus SFxL, LN229 and T98G/T98G-pcDNA cells, respectively. c GSH levels in SFxL-GLS(−), LN229-GLS(−) and T98G-GAB cells versus SFxL, LN229 and T98G/T98G-pcDNA cells, respectively, after 24 h ATO treatment (2.5 μM for SFxL and LN229 pairs, and 5 μM for T98G derivative cells). d GSH/GSSG ratios in SFxL-GLS(−), LN229-GLS(−) and T98G-GAB cells versus SFxL, LN229 and T98G/T98G-pcDNA cells, respectively, after 24 h ATO treatment (2.5 μM for SFxL and LN229 pairs, and 5 μM for T98G derivative cells). e GSH levels in SFxL-GLS(−), LN229-GLS(−) and T98G-GAB cells versus SFxL, LN229 and T98G/T98G-pcDNA cells, respectively, after 1 h treatment with H2O2 (200 μM for SFxL and LN229 pairs, and 300 μM for T98G derivative cells). f GSH/GSSG ratios in SFxL-GLS(−), LN229-GLS(−) and T98G-GAB cells versus SFxL, LN229 and T98G/T98G-pcDNA cells, respectively, after 1 h treatment with H2O2 (200 μM for SFxL and LN229 pairs, and 300 μM for T98G derivative cells). Differences were always significant (n = 3, *P< 0.01) between SFxL-GLS(−), LN229-GLS(−) or T98G-GAB cells and their respective control cells. Trasfected controls were equivalent to non-transfected cells for all type of cells. Two asterisks (**P< 0.01) indicated significantly different values between treated silenced/overexpressed cells and untreated control cells (panels c and e versus a, and panels d and f versus b). Three asterisks indicated significantly different values between treated T98G-GAB cells and treated T98G-pcDNA cells (***P< 0.01)
Fig. 7
Fig. 7
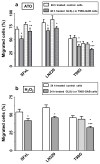
GLS silencing and GLS2 overexpression reduces glioma cells migration after an oxidative insult. Color code for bars as depicted in Fig. 2. Unfilled pattern means 24 h treatment. Dotted patter means 48 h treatment. a Cell migration of SFxL-GLS(−) cells versus SFxL, LN229-GLS(−) cells versus LN229, and T98G-GAB cells versus T98G/T98G-pcDNA after ATO treatment. b Cell migration of SFxL-GLS(−) cells versus SFxL, LN229-GLS(−) cells versus LN229, and T98G-GAB cells versus T98G/T98G-pcDNA after H2O2 treatment. Data are the mean of three independent experiments. Transacted controls were equivalent to non-transfected cells for all type of cells. Asterisk indicated significantly different values between treated silenced/overexpressed cells and treated control cells (*P< 0.01). Two asterisks indicated significantly different values between 24 h treated silenced/overexpressed cells and 48 h treated control cells (**P< 0.01). Three asterisks indicated significantly different values between treated T98G-GAB cells and treated T98G-pcDNA cells (***P< 0.01)
Fig. 8
Fig. 8
Photomicrographs of crystal violet stained cells are shown for treated SFxL, LN229 and T98G derivative cells. The number of transmigrated glioma cells was counted at 200× magnification in ten microscopic fields randomly selected and calculated as mean cell number per field. Trasfected controls did not show differences with non-transfected cells. Because space reasons only one type of control cells is shown for each assayed glioma. a Representative photomicrographs are shown after ATO treatment (24 h). b Representative photomicrographs are shown after H2O2 treatment (24 h)
Fig. 9
Fig. 9
Photomicrographs of crystal violet stained cells are shown for untreated and ATO-treated LN229 and LN229-GLS(−) cells. After culture for 12 hours, more untreated cells migrated to the centre of the wound field, whereas less ATO-treated cells and even fewer ATO-treated plus GLS-silencing cells did so. The number of transmigrated glioma cells was counted at 200× magnification in ten microscopic fields randomly selected and calculated as mean cell number per field. a Representative photomicrograph of LN229 and LN229-GLS(−) cells is shown with or without 5 μM ATO treatment (48 h). b Relative number of migrated cells are represented (value for untreated LN229 cells was set at 100%). White bars represent cells transfected with a non-silencing shRNA. Grey bars represent values for GLS-silenced cells.
Fig. 10
Fig. 10
Results of expression of c-myc, bid and bcl-2 proteins in SFxL and LN229 cells silenced cells. a Western blot analysis of glioma cell shows significant differences in the expression of some key proteins when simultaneously GLS was silenced and cells were treated during 48 h with 2.5 μM ATO. GAPDH was used as loading control. Data are from one of three representative experiments. b Relative levels of proteins as assessed by grey-values. White bars represent cells transfected with a non-silencing shRNA. Grey bars represent values for GLS-silenced cells. Quantifications were normalized to value obtained for GAPDH protein expression and represented as Integrated Optical Density (IOD)
Fig. 11
Fig. 11
Results of expression of c-myc, bid and bcl-2 proteins in T98G cells overexpressing GAB versus cells transfected with the empty vector. a Western blot analysis of glioma cell shows significant differences in the expression of some apoptotic key proteins when GAB was overexpressed. Non-transfected controls were equivalent to transacted controls. To avoid repetition, only transacted controls are shown. GAPDH was used as loading control. Data are from one of three representative experiments. b Relative levels of proteins as assessed by grey-values. White bars represent value for T98G-pcDNA (transfected control). Grey bars represent values for cells overexpressing GAB isoform. Quantifications were normalized to value obtained for GAPDH protein expression and represented as Integrated Optical Density (IOD)

Similar articles

Cited by

References

    1. Márquez J, de la Oliva AR, Matés JM, Segura JA, Alonso FJ. Glutaminase: a multifaceted protein not only involved in generating glutamate. Neurochem Int. 2006;48:465–471. - PubMed
    1. DeBerardinis RJ, Lum JJ, Hatzivassiliou G, Thompson CB. The biology of cancer: Metabolic reprogramming fuels cell growth and proliferation. Cell Metab. 2008;7:11–20. - PubMed
    1. Olalla L, Gutiérrez A, Campos JA, Khan ZU, Alonso FJ, Segura JA, Márquez J, Aledo JC. Nuclear localization of L-type glutaminase in mammalian brain. J Biol Chem. 2002;277:38939–38944. - PubMed
    1. Márquez J, Tosina M, de la Rosa V, Segura JA, Alonso FJ, Matés JM, Campos-Sandoval JA. New insights into brain glutaminases: beyond their role on glutamatergic transmission. Neurochem Int. 2009;55:64–70. - PubMed
    1. Dang CV. MYC, microRNAs and glutamine addiction in cancers. Cell Cycle. 2009;8:3243–3245. - PubMed

Publication types

MeSH terms