Review
. 2014 Jan:54:74-91.
doi: 10.1016/j.jbior.2013.10.002. Epub 2013 Nov 13.

Insights into mRNA export-linked molecular mechanisms of human disease through a Gle1 structure-function analysis

Affiliations
Review

Insights into mRNA export-linked molecular mechanisms of human disease through a Gle1 structure-function analysis

Andrew W Folkmann et al. Adv Biol Regul. 2014 Jan.

Abstract

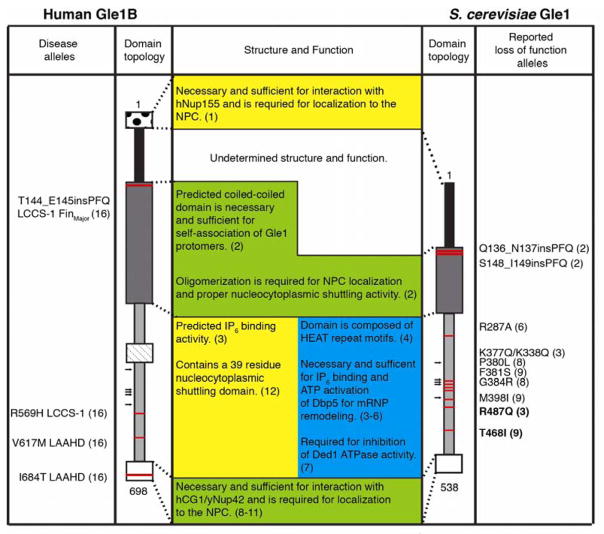
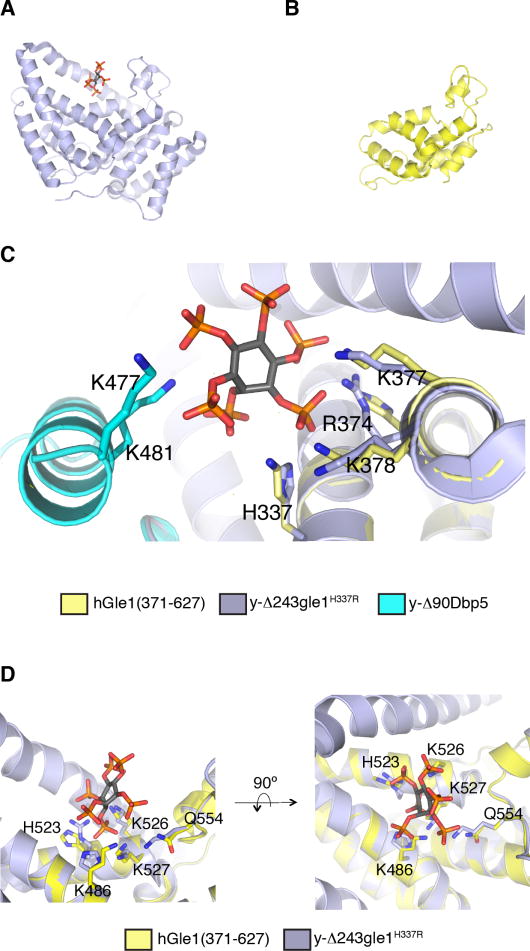
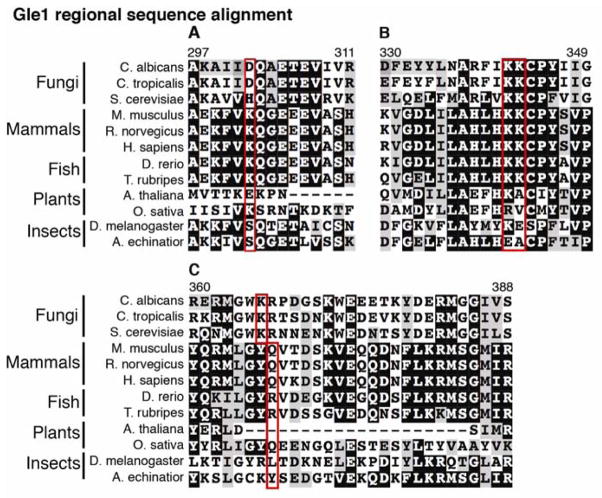
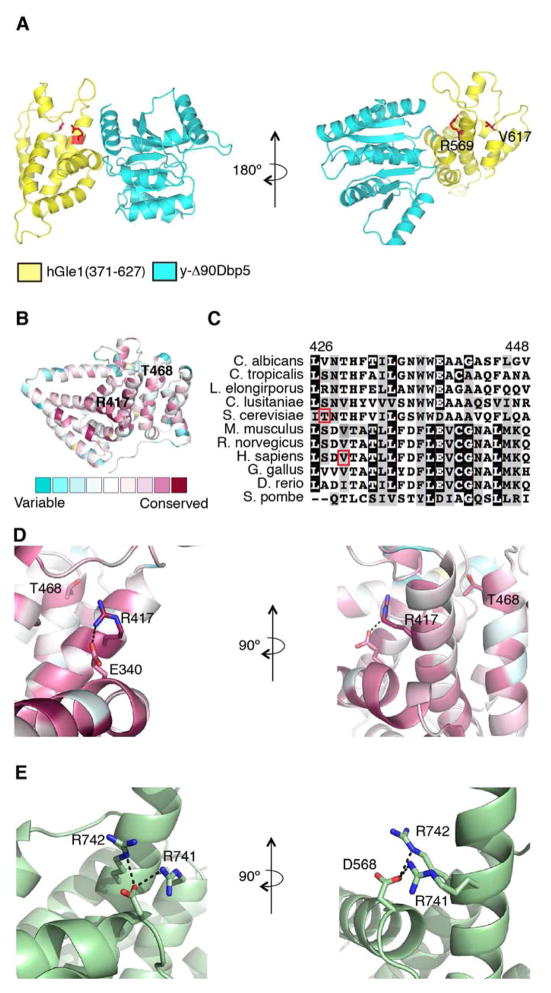
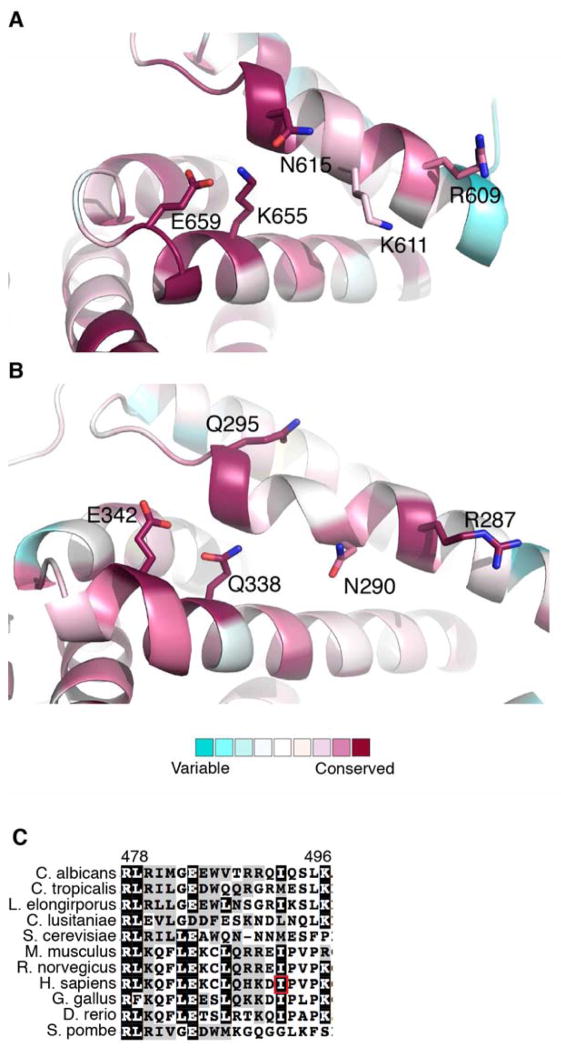
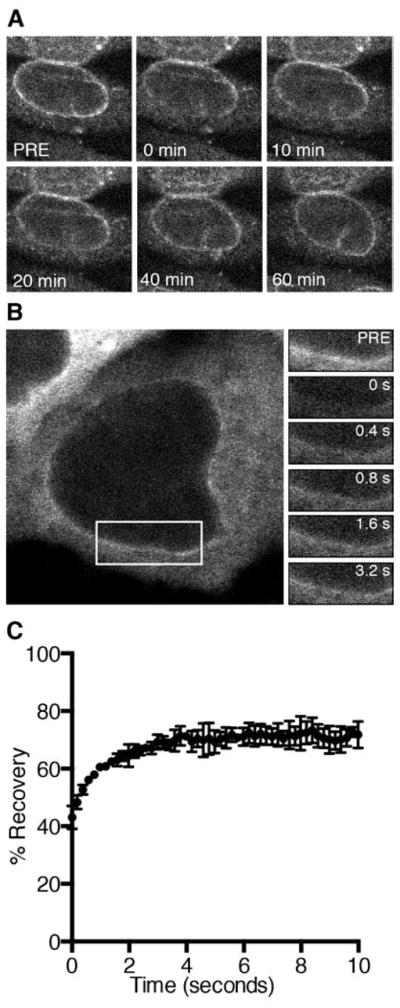
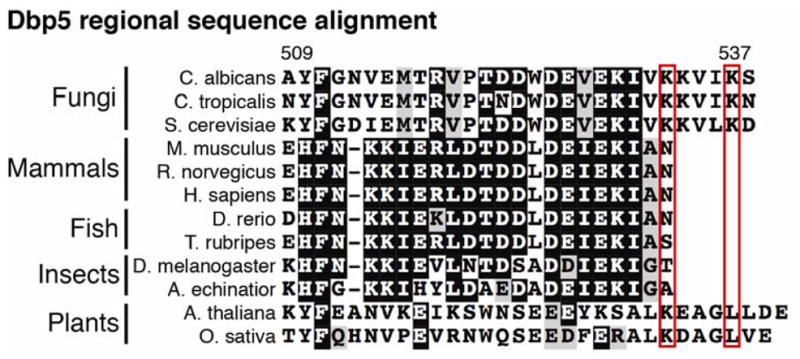
A critical step during gene expression is the directional export of nuclear messenger (m)RNA through nuclear pore complexes (NPCs) to the cytoplasm. During export, Gle1 in conjunction with inositol hexakisphosphate (IP6) spatially regulates the activity of the DEAD-box protein Dbp5 at the NPC cytoplasmic face. GLE1 mutations are causally linked to the human diseases lethal congenital contracture syndrome 1 (LCCS-1) and lethal arthrogryposis with anterior horn cell disease (LAAHD). Here, structure prediction and functional analysis provide strong evidence to suggest that the LCCS-1 and LAAHD disease mutations disrupt the function of Gle1 in mRNA export. Strikingly, direct fluorescence microscopy in living cells reveals a dramatic loss of steady-state NPC localization for GFP-gle1 proteins expressed from human gle1 genes harboring LAAHD and LCCS-1 mutations. The potential significance of these residues is further clarified by analyses of sequence and predicted structural conservation. This work offers insights into the perturbed mechanisms underlying human LCCS-1 and LAAHD disease states and emphasizes the potential impact of altered mRNA transport and gene expression in human disease.


Figures

Fig. 1
Fig. 1
Schematic depicting functional and structural domains of Human (Left) and S. Cerevisiae (Right) Gle1 proteins is shown. Red dashes indicate the relative position of indicated gle1 alleles. Black arrows mark the location of the conserved IP6-coordinating residues. References cited: (1) Rayala et al., 2004 (2) Folkmann et al., 2013 (3) Alcazar-Roman et al., 2010 (4) Montpetit et al., 2011 (5) Tran et al., 2007 (6) Weirich et al., 2006, Alcazar-Roma et al., 2010 (7) Bolger and Wente, 2011 (8) Murphy and Wente, 1996 (9) Stutz et al., 1997 (10) Strahm et al., 1999 (11) Kendirgi et al., 2005 (12) Kendirgi et al., 2003 (13) Nousianinen et al., 2008.
Fig. 2
Fig. 2
Identification of putative IP6 coordinating residues in hGle1. (A) Structure of y-Δ243gle1H337R (GRAY) [PDB 3PEU] is shown. (B) A homology model for hGle1(371-627) (YELLOW) was generated based on the crystal structure of y-Δ243gle1H337R [PDB 3PEU] using the structure prediction server Phyre-2 (Keley and Sternberg, 2009). (C–D) This model was constructed by superposing the hGle1(371-627) model onto the y-Δ243gle1H337R molecule within the y-Δ90dbp5/y-Δ243gle1H337R complex (PDB 3PEU). IP6 is rendered as a gray stick molecule with orange phosphate and red oxygen atoms. Nitrogen atoms in Gle1 structures are in blue. (C) Conserved IP6-coordinating polar residues in yGle1 and yDbp5 are labeled. (D) Conserved polar residues in hGle1 are labeled. Methods: Structural analysis and generation of the figure images was done using the program PyMOL (Schrödinger, Inc).
Fig. 3
Fig. 3
Charge conservation of the IP6 coordinating residues in Gle1 is observed in some organisms (A–C) Sequence alignment of conserved region of the C-terminal domain of Gle1 from selected fungal and metazoan species. (A) Red box indicates position of yGle1-H337 and hGle1-K486 residues. (B) Red box indicates position of yGle1-R374/K377/K378 and hGle1-H523/K526/K527 residues. (C) Red box indicates position of yGle1-K401 and hGle1-Q554 residues.
Fig. 4
Fig. 4
Conservation of intramolecular salt-bridge in yGle1 and eIF4G. (A) This model was constructed by replacing the y-Δ243gle1H337R molecule within the y-Δ90dbp5/y-Δ243 gle1H337R complex (PDB 3PEU) with the homology model of hGle1(371-627). (B) The results of the analysis of the y-Δ241gle1H337R by the ConSurf server are shown. The Gle1 structure is represented by a ribbon model, colored by the following conservation scale: dark purple residues are the most conserved; white residues are the average on the conservation scale; cyan residues are variable. (C) Sequence alignment of conserved region of the C-terminal domain of Gle1 from selected fungal and metazoan species. Sequences were aligned with ClustalX, shaded with Boxshade 2.1. Red boxes denote the positions of Thr-468 and Val-617 residues in yeast and human Gle1 respectively. (D) Conserved residues in y-Δ243gle1H337R structure are depicted. Dashed line indicated potential hydrogen bond (distance <3Å). (E) Hydrogen bond acceptor and donor residues are indicated in eIF4G structure (PDB 2VSX). Dashed line indicates potential hydrogen bond (distance <3Å). Methods: Structural analysis and generation of the figure images was done using the program PyMOL (Schrödinger, Inc). Multiple sequence alignment analysis was done using the ClustalX, and shaded with Boxshade 3.21
Fig. 5
Fig. 5
Conservation of molecular polar contact points in Gle1 and eIF4G. (A–B) The results of the analysis of the (B) y-Δ243gle1H337R [PDB 3PEU] and (C) eIF4G [PDB 2VSX] structures by the ConSurf server are shown. A ribbon model is depicted, colored by the following conservation scale, represents the structures: dark purple residues are the most conserved; white residues are the average on the conservation scale; cyan residues are variable. Conserved polar residues for yGle1 and eIF4G are labeled. (C) Sequence alignment of conserved region of the C-terminal domain of Gle1 from selected fungal and metazoan species. Sequences were aligned with ClustalX, shaded with Boxshade 2.1. Red box denotes the position of the Iso-684 hGle1B residue. Methods: Structural analysis and generation of the figure images was done using the program PyMOL (Schrödinger, Inc). Multiple sequence alignment analysis was done using the ClustalX, and shaded with Boxshade 3.21
Fig. 6
Fig. 6
LAAHD and LCCS-1Het Gle1 proteins have altered steady-state NPC localization. HeLa cells expressing POM121-mCherry and either GFP-hGLE1B, GFP-h-gle1BR569H, GFP-h-gle1BV617M, and GFP-h-gle1BI684T were visualized by direct fluorescent live cell microscopy. Bar, 10 μm. Methods: Hela cells were cultured in complete medium (DMEM, Gibco) supplemented with 10% FBS (Alanta Biologicals) at 37 °C in 5% CO2. Cells were plated in 35mm No. 1.5 glass bottom dishes (Mattek). Transient transfection with indicated plasmids was performed using Fugene6 (Promega) following manufacturer recommendations: POM121-mCherry and pSW1831 (GFP-hGle1B), pSW3971 (GFP-h-gle1BR569H), pSW3972 (GFP-h-gle1BV617M), or pSW3973 (GFP-h-gle1BI684T). All live-cell direct fluorescence microscopy experiments were performed on a confocal microscope (LSM710, Zeiss, 40X/1.1 C-Apochromat water objective).
Fig. 7
Fig. 7
Gle1 is a stable component of the NPC. (A) HeLa cells expressing GFP-hGLE1B were analyzed by FRAP microscopy. Representative nuclear rim FRAP time series images are shown. Bar, 10 μm. (B) HeLa cells expressing GFP-hDBP5 were analyzed by FRAP microscopy. Representative nuclear rim FRAP time series images are shown. Bar, 10 μm. White box indicates imaging region of interest for FRAP acquisition (C) FRAP recovery curve experimental determined bleached region, fit with a one-phase association model. Error bars represent mean ± standard deviation with n=5 cells. Methods: HeLa cells were cultured and transfected as in Figure 4. FRAP microscopy experiments were performed on HeLa cells co-transfected with POM121-mCherry and either pSW1832, or pSW3253 (GFP-hDBP5). The bleaching region of interest (B-ROI) was set to encompass the nuclear rim. Bleaching was achieved by exciting at 488 nM throughout the entire B-ROI (with a LSM710, Zeiss, 40X/1.1 C-Apochromat water objective). Post-bleaching images were acquired every 10 minutes (GFP-hGle1) or 200ms (GFP-hDbp5).
Fig. 8
Fig. 8
Charge conservation of the IP6 coordinating residues in Dbp5 is observed in some organisms. (A) Sequence alignment of the far C-terminal region in Dbp5 from selected fungal and metazoan species. Red box indicates position of yDbp5-K477/K481 residues.

Similar articles

Cited by

References

    1. Al-Qattan MM, Shamseldin HE, Alkuraya FS. Familial dorsalization of the skin of the proximal palm and the instep of the sole of the foot. Gene. 2012;500:216–9. - PubMed
    1. Alcazar-Roman AR, Bolger TA, Wente SR. Control of mRNA export and translation termination by inositol hexakisphosphate requires specific interaction with Gle1. J Biol Chem. 2010;285:16683–92. - PMC - PubMed
    1. Alcazar-Roman AR, Tran EJ, Guo S, Wente SR. Inositol hexakisphosphate and Gle1 activate the DEAD-box protein Dbp5 for nuclear mRNA export. Nature Cell Biology. 2006;8:711–6. - PubMed
    1. Ashkenazy H, Erez E, Martz E, Pupko T, Ben-Tal N. ConSurf 2010: calculating evolutionary conservation in sequence and structure of proteins and nucleic acids. Nucleic Acids Res. 2010;38:W529–33. - PMC - PubMed
    1. Ballut L, Marchadier B, Baguet A, Tomasetto C, Seraphin B, Le Hir H. The exon junction core complex is locked onto RNA by inhibition of eIF4AIII ATPase activity. Nat Struct Mol Biol. 2005;12:861–9. - PubMed

Publication types

MeSH terms

Substances

Supplementary concepts

LinkOut - more resources