. 2014 Feb;34(3):428-38.
doi: 10.1128/MCB.00946-13. Epub 2013 Nov 18.

GCN2-dependent metabolic stress is essential for endotoxemic cytokine induction and pathology

Affiliations

GCN2-dependent metabolic stress is essential for endotoxemic cytokine induction and pathology

Haiyun Liu et al. Mol Cell Biol. 2014 Feb.

Abstract

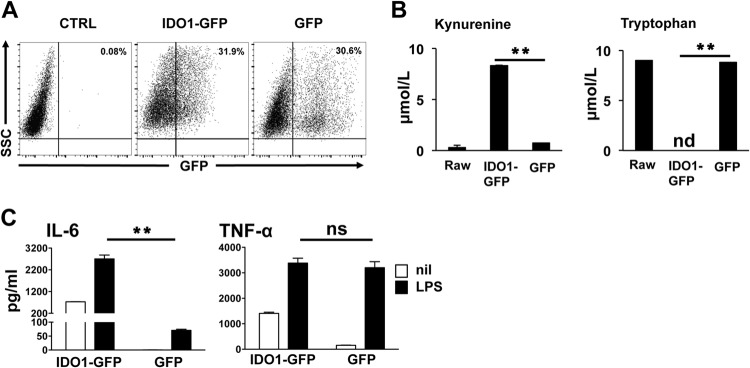
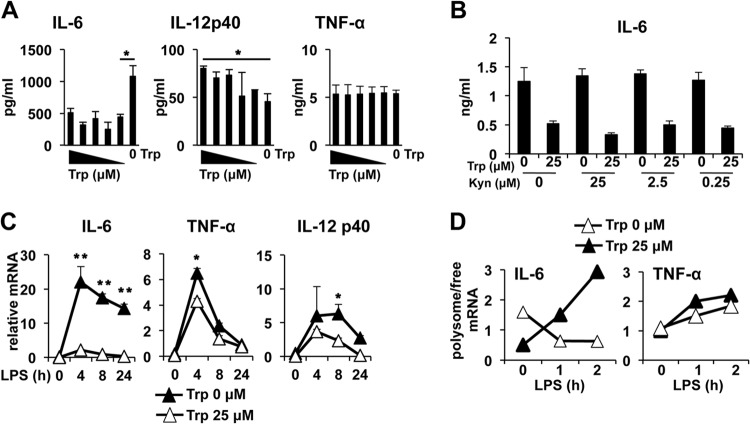
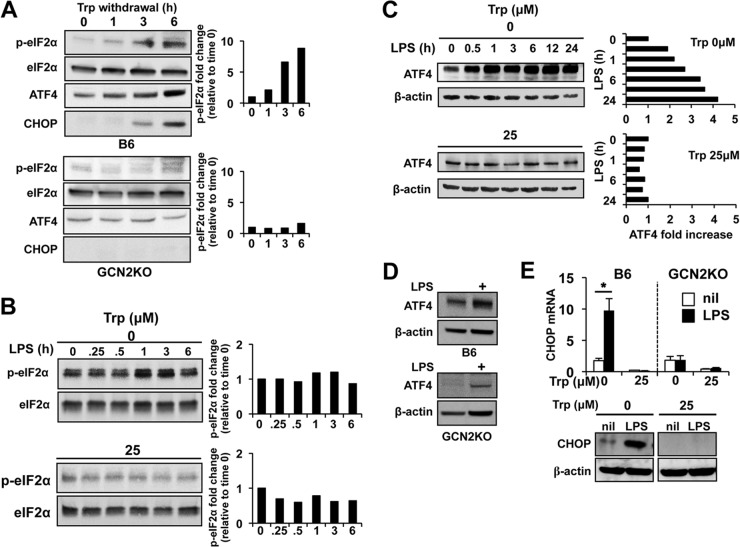
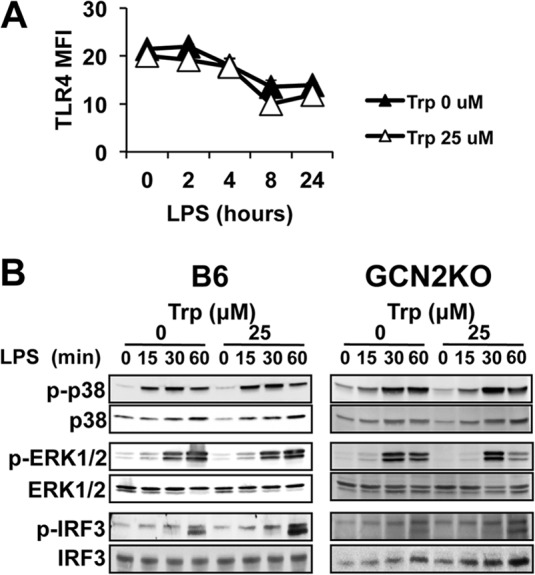
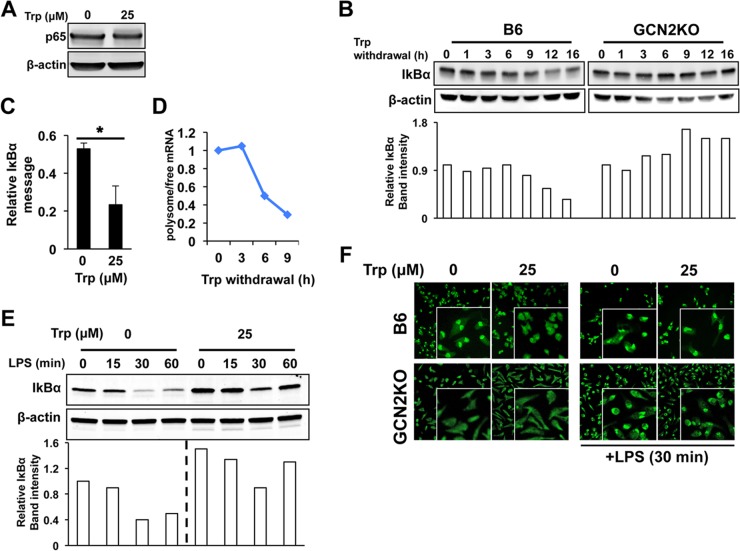
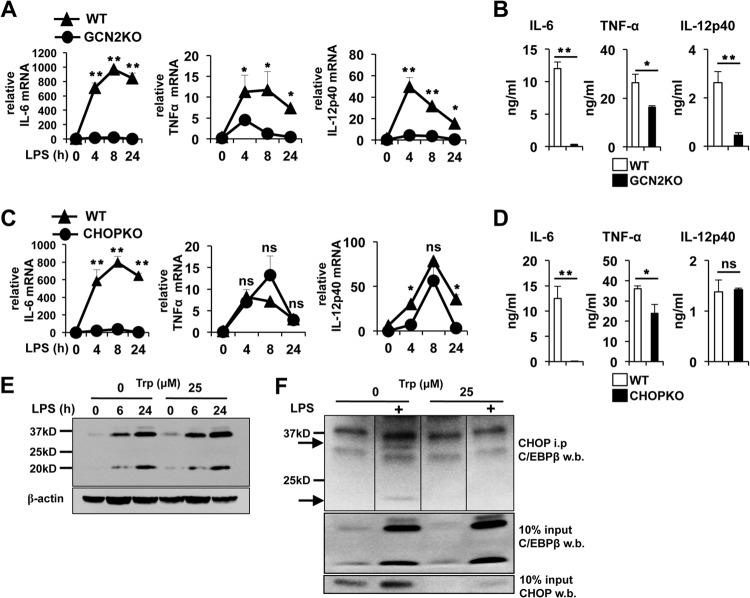
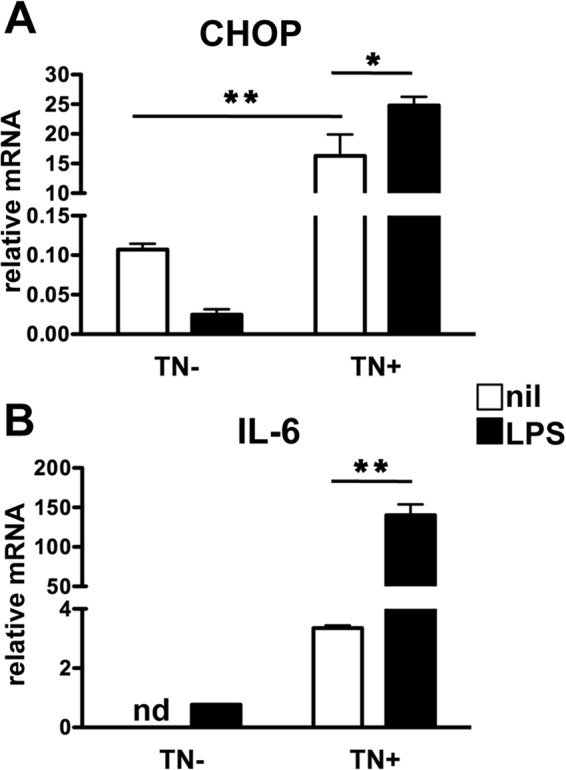
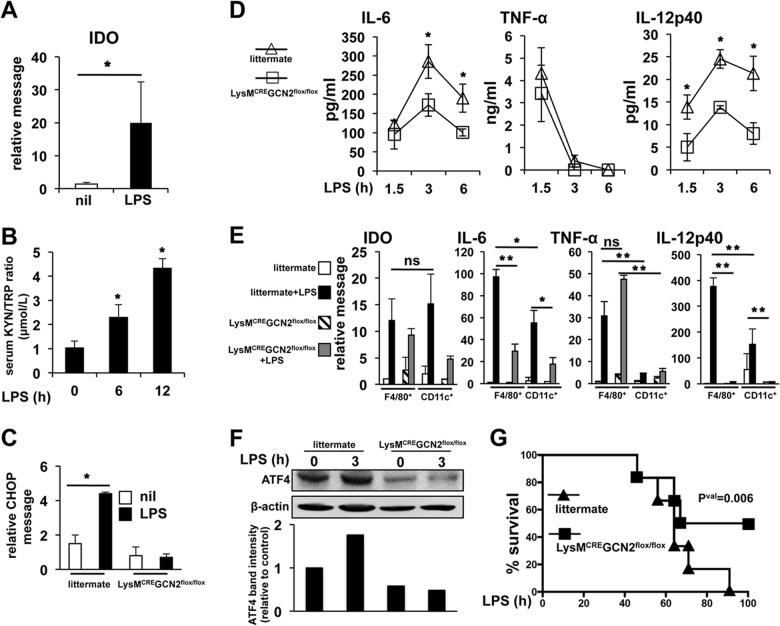
Activated inflammatory macrophages can express indoleamine 2,3-dioxygenase (IDO) and thus actively deplete their own tryptophan supply; however, it is not clear how amino acid depletion influences macrophage behavior in inflammatory environments. In this report, we demonstrate that the stress response kinase GCN2 promotes macrophage inflammation and mortality in a mouse model of septicemia. In vitro, enzymatic amino acid consumption enhanced sensitivity of macrophages to the Toll-like receptor 4 (TLR4) ligand lipopolysaccharide (LPS) with significantly increased interleukin 6 (IL-6) production. Tryptophan withdrawal induced the stress response proteins ATF4 and CHOP/GADD153; however, LPS stimulation rapidly enhanced expression of both proteins. Moreover, LPS-driven cytokine production under amino acid-deficient conditions was dependent on GCN2, as GCN2 knockout (GCN2KO) macrophages had a significant reduction of cytokine gene expression after LPS stimulation. To test the in vivo relevance of these findings, monocytic-lineage-specific GCN2KO mice were challenged with a lethal dose of LPS intraperitoneally (i.p.). The GCN2KO mice showed reduced inflammatory responses, with decreased IL-6 and IL-12 expression correlating with significant reduction in animal mortality. Thus, the data show that amino acid depletion stress signals (via GCN2) synergize with proinflammatory signals to potently increase innate immune responsiveness.


Figures

FIG 1
FIG 1
IDO enhances IL-6 production in macrophages. (A) RAW 264.7 macrophages were transduced with a lentivirus encoding an IDO1-GFP fusion protein, and 72 h later, IDO expression was assessed by flow cytometry as a function of GFP+ cells. Panels are representative of at least 5 samples per group. (B) Spontaneous kynurenine production and Trp consumption in IDO+ and control macrophage culture supernatants were assessed by HPLC as described in the text. (C) IDO+ and GFP+ control cultures were stimulated with LPS (1 μg/ml) for 18 h, and culture supernatants were tested by ELISA to determine concentrations of IL-6 and TNF-α. Bars represent the mean values for triplicate samples ± the standard deviations. **, P < 0.01 as determined by Student's t test. ns, not significant. Experiments were repeated at least three times, with similar results.
FIG 2
FIG 2
Tryptophan depletion enhances IL-6 synthesis at the mRNA level. (A) PEMs were cultured overnight in defined media with titrated concentrations of Trp and stimulated with 1 μg/ml of LPS. Eighteen hours later, culture supernatants were collected and analyzed for production of cytokines by ELISA at the indicated time points. Trp concentrations tested were 2.5, 1.25, 0.625, 0.313, 0.156, and 0 μM. (B) PEMs were cultured with increasing concentrations of a mixture of kynurenines with or without Trp and stimulated with LPS as described above. Eighteen hours later cell culture supernatants were measured by ELISA for IL-6. (C) PEMs were cultured in media with or without Trp and stimulated with LPS as for panel A. RNA was extracted at the indicated time points, and the cytokine message was quantified by sqPCR as described in Materials and Methods. (D) PEMs treated as for panel C were stimulated with 1 μg/ml of LPS, and free versus polysome-bound IL-6 and TNF-α messages were determined by sqPCR. All bars or plot points (A to C) are the mean values for triplicate samples ± the standard deviations. *, P ≤ 0.05, and **, P < 0.01, as determined by Student's t test. Experiments were repeated at least three times, with similar results.
FIG 3
FIG 3
LPS stimulation enhances GCN2-pathway activation in the absence of Trp. (A) PEMs with the GCN2 genotype indicated were cultured in Trp-free media, and lysates were collected and probed for eIF2α phosphorylation and CHOP and ATF4 expression by Western blotting as described in Materials and Methods. (B) PEMs were cultured in media containing the Trp concentrations indicated for 6 h and stimulated with 1 μg/ml of LPS. At the indicated time points, cell lysates were tested for changes in the phosphorylation of eIF2α. (C) ATF4 protein levels were assessed by Western blotting in PEMs described for panel B. (D and E) PEMs were cultured under Trp-free conditions for 12 h, followed by addition of LPS (1 μg/ml). Twelve hours after addition of LPS, PEMs were examined for CHOP expression at the message level or ATF4 or CHOP or protein level by Western blotting. Bars in panel E represent the mean values for triplicate samples ± the standard deviations. *, P = 0.001 as determined by Student's t test. Western blots are representative of at least three experiments showing similar results. All experiments were repeated three or more times, with similar results.
FIG 4
FIG 4
TLR4-mediated signal transduction is not affected by Trp withdrawal stress. PEMs were cultured for 18 h in defined media with or without Trp and stimulated with 1 μg/ml of LPS. (A) At the indicated time points, surface expression of TLR4 was determined by flow cytometric analysis. MFI, mean fluorescence. Plot points are the mean values for triplicate samples ± the standard deviations. The experiment was repeated three times, with similar results. (B) PEMs treated as for panel A were stimulated with 1 μg/ml of LPS. At the indicated time points, whole-cell lysates were probed via Western blotting for the presence of the phosphoproteins or total proteins indicated. Western blots are representative of four experiments showing similar results.
FIG 5
FIG 5
Trp withdrawal stress inhibits IκBα translation by a GCN2-dependent mechanism. (A) PEMs were cultured in Trp-free media for 16 h, and NF-κB p65 was measured in whole-cell lysates by Western blotting. (B) IκBα protein levels were determined by Western blotting at the indicated times after removal of Trp from the culture media. (C) PEMs were cultured under Trp withdrawal conditions for 16 h, and the IκBα relative message was determined by sqPCR. Bars represent the mean values for triplicate samples ± standard deviations. (D) At the indicated time points after removal of Trp from culture medium, the relative ratio of polysome (i.e., ribosome) bound versus unbound transcript for IκBα was determined by sqPCR. Plot points represent the relative value for pooled samples. (E) PEMs treated as for panel A were stimulated with 1 μg/ml of LPS, and IκBα was measured in whole-cell lysates collected at the indicated time points. (F) PEMs with the GCN2 genotype indicated were cultured for 12 h under Trp-free conditions, and cellular localization of NF-κB p65 was determined by indirect immunofluorescence. In one group the PEMs were stimulated with 1 μg/ml of LPS for 30 min prior to fixation and staining (right panels). Western blots and immunofluorescence are representative images of multiple experiments showing similar results. All experiments were repeated three or more times, with similar results.
FIG 6
FIG 6
LPS-induced induction of cytokine message is dependent on GCN2 in the absence of Trp. (A and C) PEMs with the indicated genotype were cultured in Trp-free media for 6 h and stimulated with 1 μg/ml of LPS. At the indicated time points, RNA was extracted and the cytokine message was examined by sqPCR. (B and D) Twenty-four-hour culture supernatants from PEMs treated with LPS as described for panels A and C were analyzed by ELISA for the cytokines indicated. For panels A to D, plot points and bars represent the mean values for triplicate samples ± the standard deviations. (E) Western blot analysis for expression of C/EBPβ in PEMs cultured as for panel A and stimulated with 1 μg/ml of LPS for the indicated time points. (F) PEMs cultured for 6 h with or without Trp and activated with 1 μg/ml of LPS for 24 h. CHOP from native whole-cell lysates was immunoprecipitated and probed for the presence of C/EBPβ by Western blotting as described in Materials and Methods. Arrows, LAP and LIP isoforms of C/EBPβ. *, P ≤ 0.05, and **, P < 0.01, as determined by Student's t test. ns, not significant. Experiments were repeated four times, with similar results.
FIG 7
FIG 7
ER stress synergizes with LPS-driven IL-6 message induction. PEMs were cultured in complete media with or without 2 μg/ml of TN for 3 h, followed by stimulation with 1 μg/ml of LPS for 8 h. Samples were then collected, and the relative messages for CHOP (A) and IL-6 (B) were determined by sqPCR. Bars represent mean values for triplicate samples ± standard deviations. *, P ≤ 0.05, and **, P < 0.01, as determined by Student's t test. nd, not detected. The experiment was repeated twice, with similar results.
FIG 8
FIG 8
Deletion of GCN2 in LysM-CRE GCN2flox/flox mice reduces systemic IL-6 and IL-12p40 production and protects mice from LPS-induced endotoxemic mortality. (A) Whole splenic IDO1 message was determined in B6 mice as described in the text 3 h after i.p. LPS administration. (B) Serum kynurenine/Trp ratios were determined by HPLC at the indicated time points after i.p. injection of LPS as for panel A. (C) Total splenic CHOP message was determined by sqPCR 3 h after i.p. LPS injection. (D) Serum cytokine levels were determined by ELISA at the indicated time points after i.p. injection of 15 mg/kg of LPS. (E) F4/80+ Mϕ and CD11c+ DCs were sorted by FACS 3 h after injection with LPS as for panel A, and the relative message for the indicated mRNA species compared was determined by sqPCR. (F) Splenocytes from mice treated as for panel A were pooled (n = 3), and F4/80+ macrophages were purified via MACS columns. Purified macrophages were analyzed by Western blotting for the presence of the proteins indicated. (G) Mice of the indicated genotype were injected with 15 mg/kg of LPS i.p., and mortality over a 100-h period was determined. For panels A to D, n = 5 mice/group; for panel E, n = 3 mice/group. For panel F, n = 10 mice/group. *, P ≤ 0.05, and **, P < 0.01, as determined by Student's t test. For panel F, P = 0.006, determined as described in Materials and Methods. Experiments were repeated at least three times, with similar results.

Similar articles

Cited by

References

    1. McGaha TL, Chen Y, Ravishankar B, van Rooijen N, Karlsson MC. 2011. Marginal zone macrophages suppress innate and adaptive immunity to apoptotic cells in the spleen. Blood 117:5403–5412. 10.1182/blood-2010-11-320028 - DOI - PubMed
    1. Murray PJ, Wynn TA. 2011. Protective and pathogenic functions of macrophage subsets. Nat. Rev. Immunol. 11:723–737. 10.1038/nri3073 - DOI - PMC - PubMed
    1. Ravishankar B, Liu H, Shinde R, Chandler P, Baban B, Tanaka M, Munn DH, Mellor AL, Karlsson MC, McGaha TL. 2012. Tolerance to apoptotic cells is regulated by indoleamine 2,3-dioxygenase. Proc. Natl. Acad. Sci. U. S. A. 109:3909–3914. 10.1073/pnas.1117736109 - DOI - PMC - PubMed
    1. Aragonés J, Elorza A, Acosta-Iborra B, Landazuri MO. 2011. Myeloid hypoxia-inducible factors in inflammatory diseases. Crit. Rev. Immunol. 31:1–13. 10.1615/CritRevImmunol.v31.i1.10 - DOI - PubMed
    1. McGaha TL, Huang L, Lemos H, Metz R, Mautino M, Prendergast GC, Mellor AL. 2012. Amino acid catabolism: a pivotal regulator of innate and adaptive immunity. Immunol. Rev. 249:135–157. 10.1111/j.1600-065X.2012.01149.x - DOI - PMC - PubMed

Publication types

MeSH terms

LinkOut - more resources