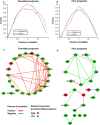
A gene expression profile related to immune dampening in the tumor microenvironment is associated with poor prognosis in gastric adenocarcinoma
- PMID: 24217965
- PMCID: PMC4223540
- DOI: 10.1007/s00535-013-0904-0
A gene expression profile related to immune dampening in the tumor microenvironment is associated with poor prognosis in gastric adenocarcinoma
Abstract
Background: The TNM Classification of Malignant Tumours (TNM) staging system is the primary means of determining a prognosis for gastric adenocarcinoma (GC). However, tumor behavior in the individual patient is unpredictable and in spite of treatment advances, a classification of 'advanced stage' still portends a poor prognosis. Thus, further insights from molecular analyses are needed for better prognostic stratification and determination of new therapeutic targets.
Methods: A total of fifty-one fresh frozen tumor samples from patients with histopathologically confirmed diagnoses of GC, submitted to surgery with curative intent, were included in the study. Total RNA was extracted from an initial group of fifteen samples matched for known prognostic factors, categorized into two subgroups, according to patient overall survival: poor (<24 months) or favorable (at or above 24 months), and hybridized to Affymetrix Genechip human genome U133 plus 2.0 for genes associated with prognosis selection. Thirteen genes were selected for qPCR validation using those initial fifteen samples plus additional thirty-six samples.
Results: A total of 108 genes were associated with poor prognosis, independent of tumor staging. Using systems biology, we suggest that this panel reflects the dampening of immune/inflammatory response in the tumor microenvironment level and a shift to Th2/M2 activity. A gene trio (OLR1, CXCL11 and ADAMDEC1) was identified as an independent marker of prognosis, being the last two markers validated in an independent patient cohort.
Conclusions: We determined a panel of three genes with prognostic value in gastric cancer, which should be further investigated. A gene expression profile suggestive of a dysfunctional inflammatory response was associated with unfavorable prognosis.
Figures


Similar articles
-
Prognostic Implications of Novel Gene Signatures in Gastric Cancer Microenvironment.Med Sci Monit. 2020 Aug 2;26:e924604. doi: 10.12659/MSM.924604. Med Sci Monit. 2020. PMID: 32740646 Free PMC article.
-
Immune landscape of advanced gastric cancer tumor microenvironment identifies immunotherapeutic relevant gene signature.BMC Cancer. 2021 Dec 11;21(1):1324. doi: 10.1186/s12885-021-09065-z. BMC Cancer. 2021. PMID: 34893046 Free PMC article.
-
Glycolysis-related genes predict prognosis and indicate immune microenvironment features in gastric cancer.BMC Cancer. 2024 Aug 8;24(1):979. doi: 10.1186/s12885-024-12747-z. BMC Cancer. 2024. PMID: 39118022 Free PMC article.
-
Is there still a place for conventional histopathology in the age of molecular medicine? Laurén classification, inflammatory infiltration and other current topics in gastric cancer diagnosis and prognosis.Histol Histopathol. 2021 Jun;36(6):587-613. doi: 10.14670/HH-18-309. Epub 2021 Feb 10. Histol Histopathol. 2021. PMID: 33565601 Review.
-
A Comprehensive Review of Prognostic Factors in Patients with Gastric Adenocarcinoma.Cancers (Basel). 2023 Mar 6;15(5):1628. doi: 10.3390/cancers15051628. Cancers (Basel). 2023. PMID: 36900419 Free PMC article. Review.
Cited by
-
Meta-Analysis Reveals the Prognostic Relevance of Nuclear and Membrane-Associated Bile Acid Receptors in Gastric Cancer.Clin Transl Gastroenterol. 2021 Jan 12;12(1):e00295. doi: 10.14309/ctg.0000000000000295. Clin Transl Gastroenterol. 2021. PMID: 33492921 Free PMC article.
-
Upregulation of ADAMDEC1 correlates with tumor progression and predicts poor prognosis in non-small cell lung cancer (NSCLC) via the PI3K/AKT pathway.Thorac Cancer. 2022 Apr;13(7):1027-1039. doi: 10.1111/1759-7714.14354. Epub 2022 Feb 17. Thorac Cancer. 2022. PMID: 35178875 Free PMC article.
-
Integrative bioinformatics approaches to establish potential prognostic immune-related genes signature and drugs in the non-small cell lung cancer microenvironment.Front Pharmacol. 2023 Apr 3;14:1153565. doi: 10.3389/fphar.2023.1153565. eCollection 2023. Front Pharmacol. 2023. PMID: 37077811 Free PMC article.
-
Monoclonal antibodies targeting the disintegrin-like domain of ADAMDEC1 modulates the proteolytic activity and enables quantification of ADAMDEC1 protein in human plasma.MAbs. 2018 Jan;10(1):118-128. doi: 10.1080/19420862.2017.1395541. Epub 2017 Nov 29. MAbs. 2018. PMID: 29185848 Free PMC article.
-
Construction and Validation of an Immune-Related Prognostic Model Based on TP53 Status in Colorectal Cancer.Cancers (Basel). 2019 Nov 4;11(11):1722. doi: 10.3390/cancers11111722. Cancers (Basel). 2019. PMID: 31689990 Free PMC article.
References
-
- Tanigawa N, Amaya H, Matsumura M, Shimomatsuya T. Correlation between expression of vascular endothelial growth factor and tumor vascularity, and patient outcome in human gastric carcinoma. J Clin Oncol. 1997;15:826–832. - PubMed
Publication types
MeSH terms
Substances
Associated data
- Actions
LinkOut - more resources
Full Text Sources
Other Literature Sources
Medical
Miscellaneous

