. 2013 Nov 11;203(3):505-20.
doi: 10.1083/jcb.201306036.

The midbody ring scaffolds the abscission machinery in the absence of midbody microtubules

Affiliations

The midbody ring scaffolds the abscission machinery in the absence of midbody microtubules

Rebecca A Green et al. J Cell Biol. .

Abstract

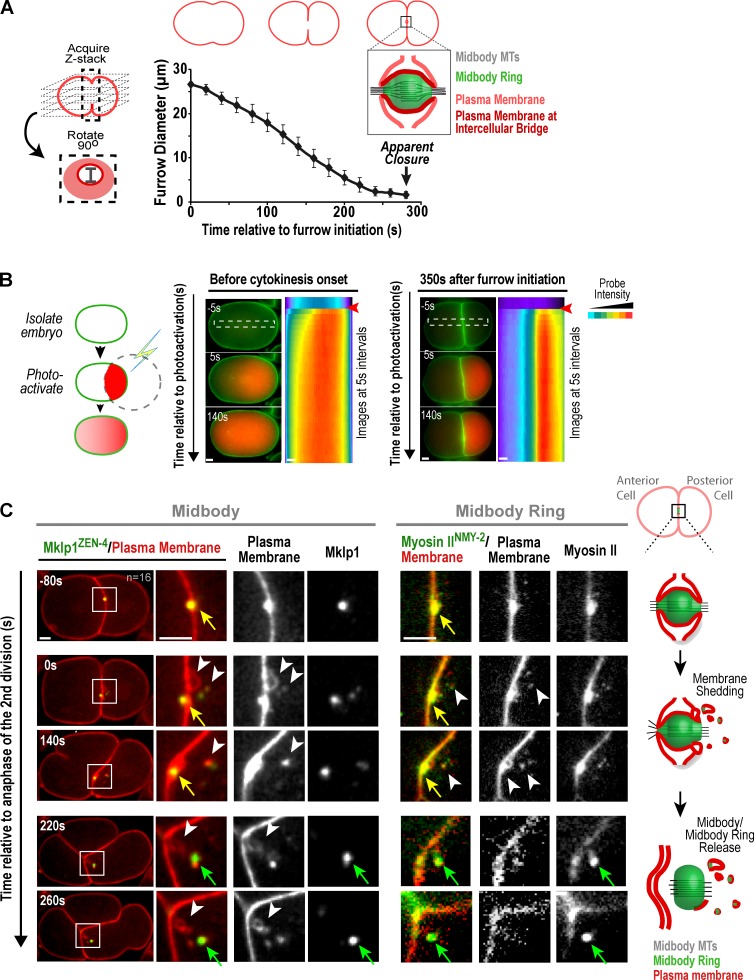
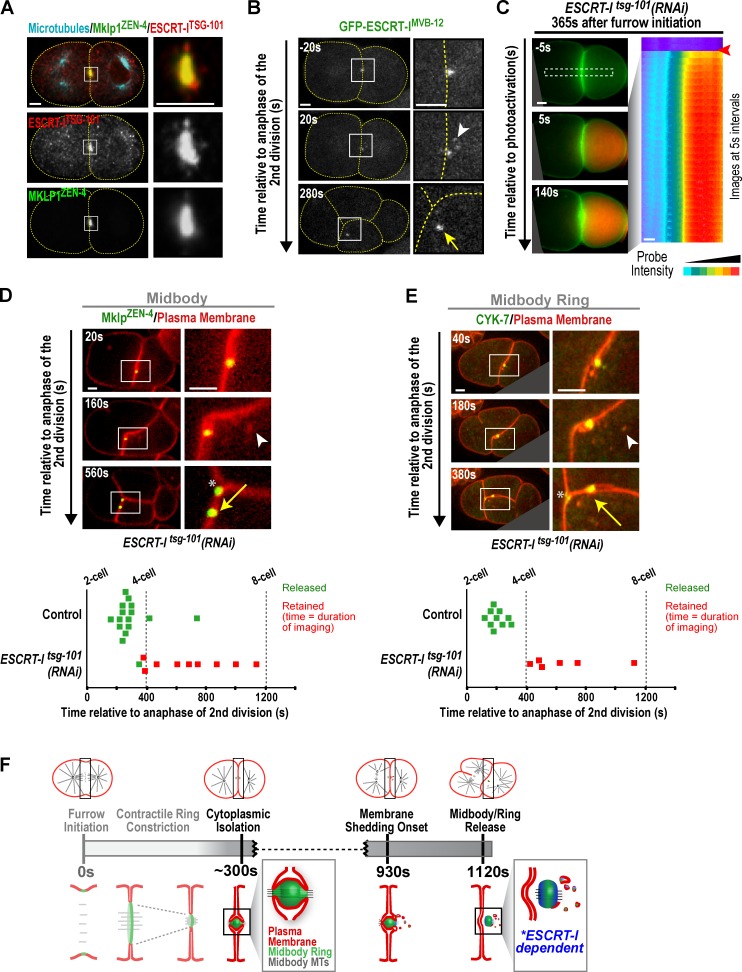
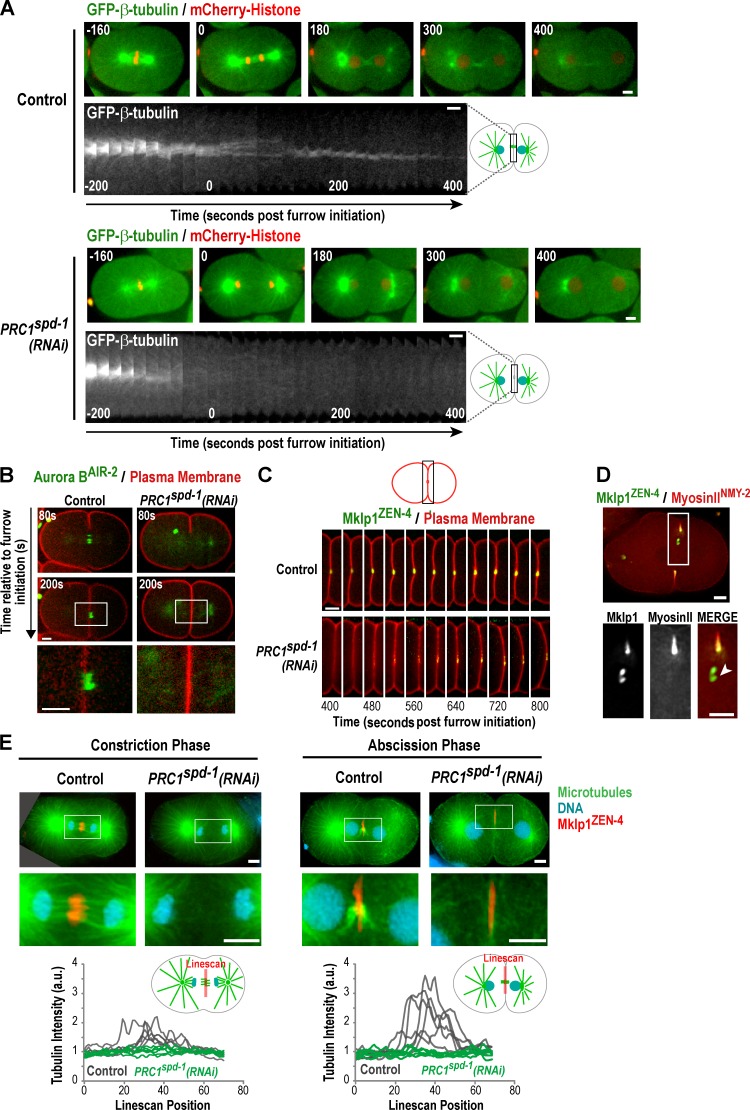
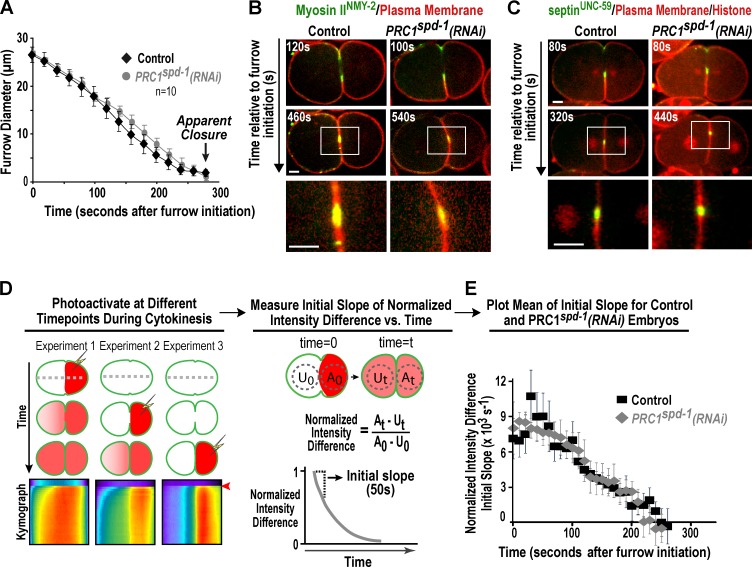
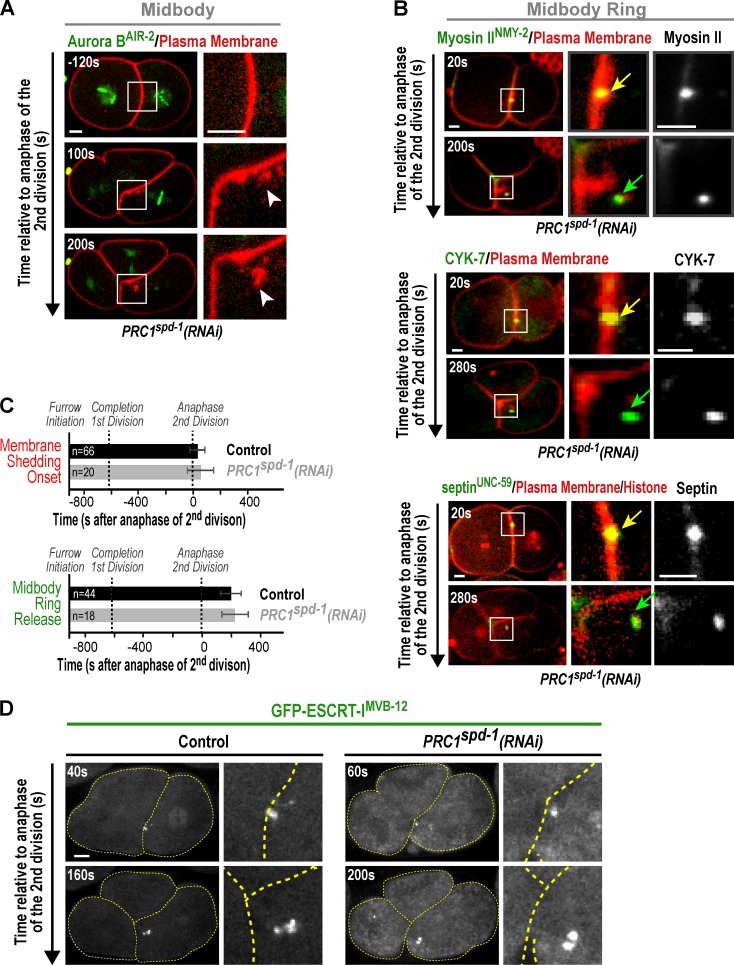
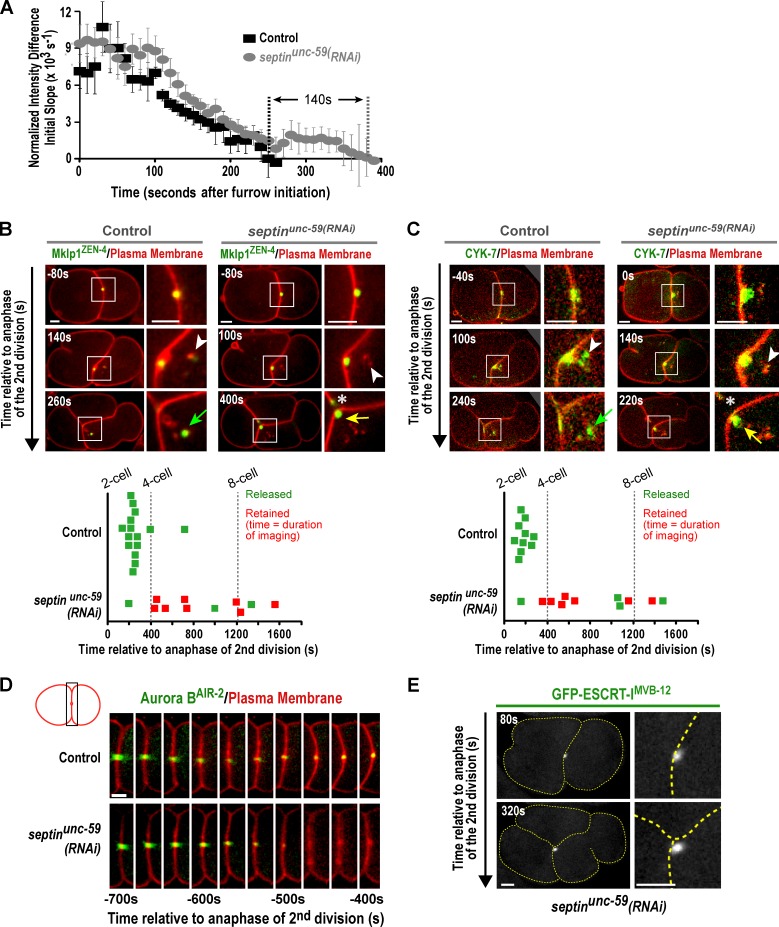
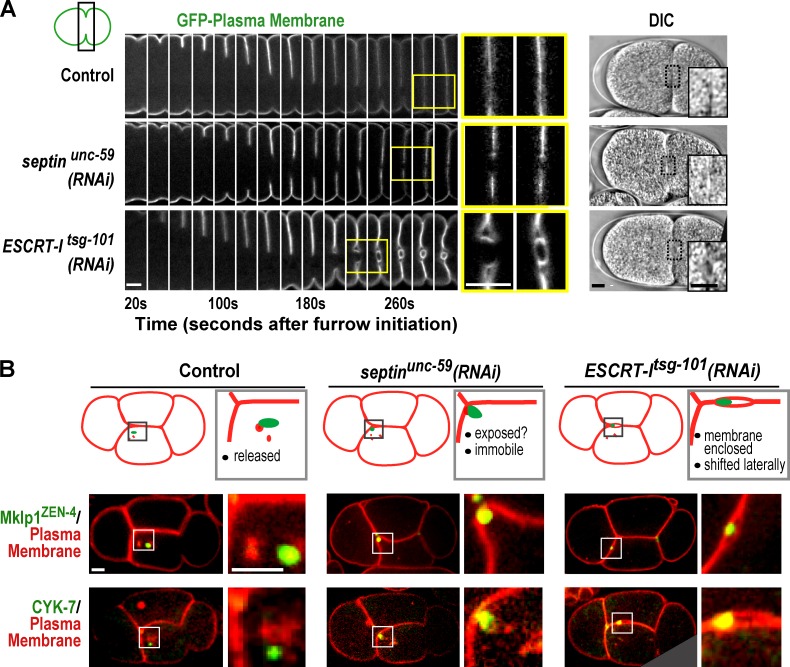
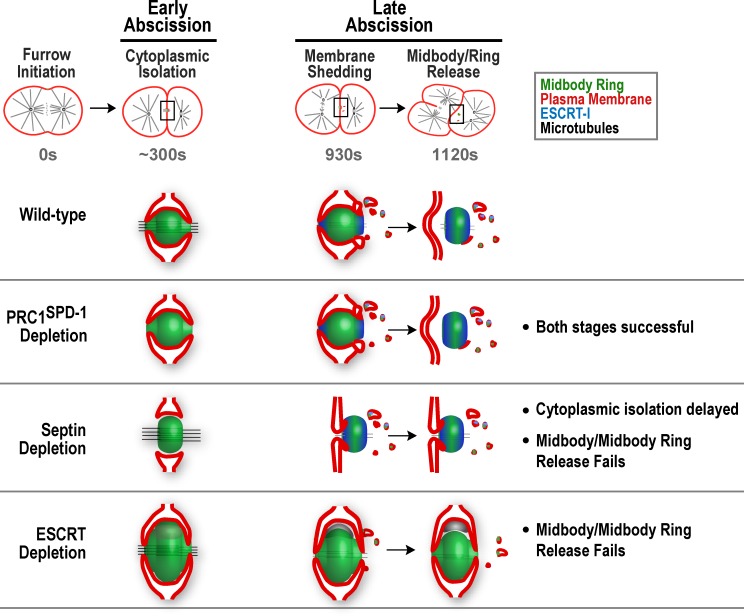
Abscission completes cytokinesis to form the two daughter cells. Although abscission could be organized from the inside out by the microtubule-based midbody or from the outside in by the contractile ring-derived midbody ring, it is assumed that midbody microtubules scaffold the abscission machinery. In this paper, we assess the contribution of midbody microtubules versus the midbody ring in the Caenorhabditis elegans embryo. We show that abscission occurs in two stages. First, the cytoplasm in the daughter cells becomes isolated, coincident with formation of the intercellular bridge; proper progression through this stage required the septins (a midbody ring component) but not the membrane-remodeling endosomal sorting complex required for transport (ESCRT) machinery. Second, the midbody and midbody ring are released into a specific daughter cell during the subsequent cell division; this stage required the septins and the ESCRT machinery. Surprisingly, midbody microtubules were dispensable for both stages. These results delineate distinct steps during abscission and highlight the central role of the midbody ring, rather than midbody microtubules, in their execution.


Figures

Figure 1.
Figure 1.
Abscission occurs in two stages: cytoplasmic isolation and release of the midbody/midbody ring. (A) Furrow diameter was measured in projections of the central region of z stacks of embryos (n = 10) expressing a GFP-tagged plasma membrane probe. (right) Graph plots mean furrow diameter versus time after furrow initiation. Arrow indicates the last time point when a hole can be detected (apparent closure). Error bars are the SDs. (top) Schematics illustrate shape changes during the first division in the C. elegans embryo, highlighting intercellular bridge structure. MTs, microtubules. (B, left) Schematic illustrates the method for monitoring the diffusion of photoactivated dextran between the two half-cells before and after cytokinesis. Examples of probe diffusion in embryos photoactivated before cytokinesis onset (middle; n = 12 embryos) and after apparent closure (right; n = 8 embryos, example shown is 350 s after furrow initiation). Central plane images show the embryos before activation (−5 s), immediately after activation (5 s), and 140 s after activation (140 s). Kymographs were constructed by aligning strips (narrow rectangles) from images collected at 5-s intervals. Red arrow denotes the point of photoactivation. (C) Central plane fluorescence confocal images of embryos expressing a fluorescently tagged plasma membrane probe (red in merged images) along with either the midbody marker mCherry-Mklp1ZEN-4 (n = 18 embryos) or the midbody ring marker Myosin IINMY-2–GFP (n = 14 embryos). Times are relative to anaphase of the second division (∼900 s after initiation of the first division furrow). Different embryos are shown to illustrate membrane shedding (−80 to 140–s time points) and midbody/midbody ring release (220–260-s time points). White boxes on the low magnification images mark the location of the region shown at higher magnification in the three adjacent panels. Loops and released fragments marked with the plasma membrane probe are indicated (white arrowheads). Yellow arrows denote mCherry-Mklp1ZEN-4–marked or Myosin IINMY-2–GFP-marked midbody remnants before release from the cell–cell junction. Green arrows mark the same components after release. Schematics illustrate events at each stage. Bars, 5 µm.
Figure 2.
Figure 2.
The ESCRT machinery is required for midbody/midbody ring release. (A) Deconvolved wide-field image of an embryo stained for tubulin (cyan), Mklp1ZEN-4, and ESCRT-ITSG-101 (n = 5 embryos). (B) Central plane confocal images of embryos expressing GFP–ESCRT-IMVB-12 (n = 6 embryos). Times are relative to anaphase of the second division. Dashed yellow lines mark the cell boundaries. The white arrowhead and yellow arrow mark the focus of GFP-ESCRT-IMVB-12 before and after release from the cell–cell boundary, respectively. (C) Example of an ESCRT-Itsg-101(RNAi) embryo in which a 10-kD dextran probe was photoactivated after apparent closure (n = 4 embryos). Central plane images show the embryo before activation (−5 s), immediately after activation (5 s), and 140 s after activation (140 s). A kymograph was constructed by aligning strips (narrow rectangle) from images collected at 5-s intervals. Red arrow denotes the point of photoactivation. (D and E, top) Central plane confocal images of ESCRT-Itsg-101(RNAi) embryos expressing a fluorescently tagged plasma membrane probe along with the midbody marker mCherry-Mklp1ZEN-4 (D; n = 10 embryos) or the midbody ring marker GFP–CYK-7 (E; n = 6 embryos). Times are relative to anaphase of the second division. Released fragments marked with the plasma membrane probe (white arrowheads) and the mCherry-Mklp1ZEN-4–marked or GFP–CYK-7–marked midbody remnants are indicated (yellow arrows). Asterisks mark the new midbody/midbody rings arising from the second embryonic division. (bottom) Graphs plotting the times when the mCherry-Mklp1ZEN-4–marked midbodies or GFP–CYK-7–marked midbody rings were released in control and ESCRT-Itsg-101(RNAi) embryos. In cases in which the midbody/midbody ring was not released, the data point reflects the endpoint of the time-lapse sequence. (F) Timeline summarizes the key events during contractile ring constriction (light gray) and abscission (dark gray). MTs, microtubules. White boxes on the low magnification images in A, B, D, and E mark the location of the region shown at higher magnification in the adjacent images. Bars, 5 µm.
Figure 3.
Figure 3.
PRC1SPD-1 depletion prevents the formation of midbody microtubule bundles and Aurora BAIR-2 targeting to the intercellular bridge. (A) Central plane confocal images of control (top; n = 8 embryos) and PRC1spd-1(RNAi) (bottom; n = 9) embryos expressing GFP–β-tubulin and mCherry-histone. Kymographs of the GFP–β-tubulin signal in the midbody region are also shown. Times are seconds after furrow initiation. (B) Central plane confocal images of control (n = 5) and PRC1spd-1(RNAi) (n = 5) embryos expressing GFP–Aurora BAIR-2 along with the mCherry-tagged plasma membrane probe. Times are seconds after furrow initiation. (C) The central region of confocal images of control (n = 18) and PRC1spd-1(RNAi) embryos (n = 7) expressing a GFP-tagged plasma membrane probe and mCherry-Mklp1ZEN-4 are shown at different time points after furrow initiation. (D) Deconvolved wide-field image (single z plane) of a control embryo stained for MyosinNMY-2 and MKLP1ZEN-4 along with tubulin and DNA (not depicted). DNA condensation and midbody compaction indicate that this is an abscission phase embryo whose furrow retracted during the freeze-crack fixation. Insets show MKLP1ZEN-4 at the midbody (white arrowhead) and overlapping with MyosinNMY-2 on the midbody ring. (E, top) Deconvolved wide-field images of control and PRC1spd-1(RNAi) embryos fixed during constriction phase (left) or abscission phase (right) and stained for tubulin (green), DNA, and Mklp1ZEN-4. Images are 2-µm projections through the central region of the embryo. (bottom) Traces show line scans (20 × 70 pixels) drawn across the center of control and PRC1spd-1(RNAi) embryos (n = 6 control and 6 PRC1spd-1(RNAi) embryos for each phase imaged in a single experiment). Intensity values were normalized by dividing by the mean fluorescence intensity in the cytoplasm near the cell periphery. a.u., arbitrary unit. White boxes on the low magnification images in B, D, and E mark the location of the region shown at higher magnification in the images at the bottom. Bars, 5 µm.
Figure 4.
Figure 4.
Furrow ingression and cytoplasmic isolation occur with normal timing in the absence of midbody microtubules. (A) Graph plotting mean furrow diameter versus time, for the first division of control (reproduced from Fig. 1 A for comparison) and PRC1spd-1(RNAi) embryos (n = 10 embryos for each condition). Error bars are the SDs. Arrow denotes the last time point with a measurable opening (apparent closure). (B and C) Central plane confocal images of control and PRC1spd-1(RNAi) embryos expressing Myosin IINMY-2–GFP along with the mCherry-tagged plasma membrane probe (B, n = 5 for each condition) or GFP-septinUNC-59 along with the mCherry-tagged plasma membrane probe and mCherry-histone (C; n = 5 for each condition). Times are seconds after furrow initiation. (D) Outline of the method used to compare cytoplasmic isolation kinetics in control and PRC1spd-1(RNAi) embryos. Embryos expressing the GFP-tagged plasma membrane probe loaded with 10-kD caged carboxy-Q-rhodamine–labeled dextran were photoactivated on one side at different time points after furrow initiation, and images were collected at 5-s intervals to monitor probe diffusion. Kymographs are shown for embryos photoactivated early in cytokinesis, midcytokinesis, and at closure (the early and closure kymographs are reproduced from Fig. 1 B). Red arrows denote the point of photoactivation. The NID between the activated (A) and unactivated (U) halves of the embryo, calculated as shown, was plotted versus time, and the initial slope of the intensity difference, which reflects the rate of diffusion across the division plane, was calculated. (E) Graph plotting the mean initial slope of the NID versus time in seconds after furrow initiation for control and PRC1spd-1(RNAi) embryos. Error bars are the 90% confidence interval; mean n = 10 slope measurements per time point. White boxes on the low magnification images in B and C mark the location of the region shown at higher magnification in the images at the bottom. Bars, 5 µm.
Figure 5.
Figure 5.
Midbody microtubules are not required for membrane shedding, ESCRT recruitment, or midbody ring release. (A) Central plane confocal images showing membrane shedding (white arrowheads) at the cell–cell boundary in a PRC1spd-1(RNAi) embryo (n = 9 embryos) expressing an mCherry-tagged plasma membrane probe and GFP–Aurora BAIR-2. Times are relative to anaphase of the second division. (B) Central plane confocal images showing midbody ring release in a PRC1spd-1(RNAi) embryo expressing the midbody ring markers Myosin IINMY-2–GFP (n = 8 embryos), GFP–CYK-7 (n = 10 embryos), or GFP-septinUNC-59 (n = 5 embryos) along with the mCherry-tagged plasma membrane probe and mCherry-histone. Times are relative to anaphase of the second division. Midbody rings are highlighted before (yellow arrows) and after (green arrows) release from the cell–cell junction. (C) Graphs plotting the mean onset of membrane shedding (top) and midbody ring release (bottom) for control and PRC1spd-1(RNAi) embryos. Error bars are the SDs. (D) Central plane confocal images of control (n = 6 embryos) and PRC1spd-1(RNAi) (n = 7 embryos) embryos expressing GFP–ESCRT-IMVB-12. Times are relative to anaphase of the second division. Dashed yellow lines mark the cell boundaries. Images are scaled equivalently. White boxes on the low magnification images in A and B mark the location of the region shown at higher magnification in the adjacent images. Bars, 5 µm.
Figure 6.
Figure 6.
The septins are required for timely cytoplasmic isolation and for midbody release. (A) Graph plotting the mean initial slope of the NID versus time in seconds after furrow initiation for control and septinunc-59(RNAi) embryos. Error bars are the 90% confidence interval; mean n = 10 slope measurements per time point. (B and C, top) Central plane confocal images of control and septinunc-59(RNAi) embryos expressing a fluorescently tagged plasma membrane probe and the midbody markers mCherry-Mklp1ZEN-4 (B; n = 11 embryos) or GFP–CYK-7 (C; n = 11 embryos). Times are relative to anaphase of the second division. Released fragments marked with the plasma membrane probe are indicated (white arrowheads). Arrows point to the midbody/midbody ring from the first division, which is released in control embryos (green arrows) and fails to be released in septinunc-59(RNAi) embryos (yellow arrows). Asterisks mark the tip of the ingressing furrow from the second embryonic division. (bottom) Graphs plotting the times when the mCherry-Mklp1ZEN-4–marked midbodies or GFP–CYK-7–marked midbody rings were released. In cases in which the midbody/midbody ring was not released, the data point refers to the endpoint of the time-lapse sequence. (D) The central region of confocal images of control (n = 11) and septinunc-59(RNAi) (n = 10) embryos expressing the mCherry-tagged plasma membrane probe and GFP–Aurora BAIR-2. (E) Confocal images of septinunc-59(RNAi) (n = 6 embryos) embryos expressing GFP–ESCRT-IMVB-12. Times in D and E are relative to anaphase of the second division. Dashed yellow lines mark the cell boundaries. Bars, 5 µm.
Figure 7.
Figure 7.
The septins and ESCRT machinery function at different stages of abscission. (A, left) The central region of confocal images of control, septinunc-59(RNAi), and ESCRT-Itsg-101(RNAi) (>10 embryos for each condition) embryos expressing a GFP-tagged plasma membrane probe at different time points after furrow initiation. (right) Differential interference contrast (DIC) images of control, septinunc-59(RNAi), or ESCRT-Itsg-101(RNAi) embryos at the two-cell stage. The region in the yellow boxes is shown at higher magnification in the images to the right. (B) Central plane confocal images of four-cell stage control, septinunc-59(RNAi), and ESCRT-Itsg-101(RNAi) embryos expressing a fluorescently tagged plasma membrane probe along with the midbody marker mCherry-MKLP1ZEN-4 (top; n = 21 control, 12 septinunc-59(RNAi), and 16 ESCRT-Itsg-101(RNAi) embryos) or the midbody ring marker GFP–CYK-7 (bottom; n = 19 control, 12 septinunc-59(RNAi), and 6 ESCRT-Itsg-101(RNAi) embryos). The midbody is released into the posterior cell in control embryos, protrudes from cell–cell boundary in septinunc-59(RNAi) embryos, and is enclosed within a plasma membrane–bound compartment embedded in the cell–cell boundary in ESCRT-Itsg-101(RNAi) embryos. White boxes on the low magnification images mark the location of the region shown at higher magnification in the adjacent images. Bars, 5 µm.
Figure 8.
Figure 8.
Model for the roles of midbody microtubules, the septins, and the ESCRT machinery in the two stages of abscission in the C. elegans embryo. Abscission occurs in two stages in wild-type C. elegans embryos. In the first stage (early abscission), cytoplasmic isolation occurs as furrow ingression completes, and an intercellular bridge forms between the two daughter cells (∼300 s). The second stage (late abscission) occurs almost one cell cycle later, coincident with the onset of anaphase of the second round of cell division. During late abscission, the intercellular bridge is remodeled, releasing fragments containing plasma membrane and cortical components (membrane shedding; 930 s), and the midbody and midbody ring are released into the posterior cell via an ESCRT-dependent process (midbody/ring release; 1,120 s). In PRC1SPD-1-depleted embryos, events during both early and late abscission occur with normal kinetics. In septin-depleted embryos, events during both early and late abscission are defective, cytoplasmic isolation is delayed, and the midbody and midbody ring fail to release into the posterior cell. When the ESCRT machinery is depleted, the furrow envelops the midbody, and cytoplasmic isolation occurs with normal timing. However, the intercellular bridge is distended, suggesting the presence of an occlusion enveloped along with the midbody. As the intercellular bridge matures, the midbody and midbody ring are pushed to one side of the intercellular bridge and fail to release into the posterior cell.

Similar articles

Cited by

References

    1. Agromayor M., Martin-Serrano J. 2013. Knowing when to cut and run: mechanisms that control cytokinetic abscission. Trends Cell Biol. 23:433–441 10.1016/j.tcb.2013.04.006 - DOI - PubMed
    1. Audhya A., Hyndman F., McLeod I.X., Maddox A.S., Yates J.R., III, Desai A., Oegema K. 2005. A complex containing the Sm protein CAR-1 and the RNA helicase CGH-1 is required for embryonic cytokinesis in Caenorhabditis elegans. J. Cell Biol. 171:267–279 10.1083/jcb.200506124 - DOI - PMC - PubMed
    1. Audhya A., McLeod I.X., Yates J.R., Oegema K. 2007. MVB-12, a fourth subunit of metazoan ESCRT-I, functions in receptor downregulation. PLoS ONE. 2:e956 10.1371/journal.pone.0000956 - DOI - PMC - PubMed
    1. Bastos R.N., Barr F.A. 2010. Plk1 negatively regulates Cep55 recruitment to the midbody to ensure orderly abscission. J. Cell Biol. 191:751–760 10.1083/jcb.201008108 - DOI - PMC - PubMed
    1. Bembenek J.N., Verbrugghe K.J., Khanikar J., Csankovszki G., Chan R.C. 2013. Condensin and the spindle midzone prevent cytokinesis failure induced by chromatin bridges in C. elegans embryos. Curr. Biol. 23:937–946 10.1016/j.cub.2013.04.028 - DOI - PMC - PubMed

Publication types

MeSH terms