. 2013 Nov 20;80(4):934-46.
doi: 10.1016/j.neuron.2013.08.024. Epub 2013 Nov 7.

Reelin mobilizes a VAMP7-dependent synaptic vesicle pool and selectively augments spontaneous neurotransmission

Affiliations

Reelin mobilizes a VAMP7-dependent synaptic vesicle pool and selectively augments spontaneous neurotransmission

Manjot Bal et al. Neuron. .

Abstract

Reelin is a glycoprotein that is critical for proper layering of neocortex during development as well as dynamic regulation of glutamatergic postsynaptic signaling in mature synapses. Here, we show that Reelin also acts presynaptically, resulting in robust rapid enhancement of spontaneous neurotransmitter release without affecting properties of evoked neurotransmission. This effect of Reelin requires a modest but significant increase in presynaptic Ca(2+) initiated via ApoER2 signaling. The specificity of Reelin action on spontaneous neurotransmitter release is encoded at the level of vesicular SNARE machinery as it requires VAMP7 and SNAP-25 but not synaptobrevin2, VAMP4, or vti1a. These results uncover a presynaptic regulatory pathway that utilizes the heterogeneity of synaptic vesicle-associated SNAREs and selectively augments action potential-independent neurotransmission.


Figures

Figure 1
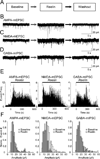
Figure 1. Reelin increases the frequency of spontaneous neurotransmission
(A) Whole-cell voltage clamp recordings of AMPA-mEPSCs, NMDA-mEPSCs as well as GABA- mIPSCs were performed for 5 minutes in normal Tyrode’s solution (baseline), followed by at least 5 minute-long Reelin application and subsequent 5 minutes during washout of Reelin. (B, C and D) Example traces of spontaneous neurotransmission derived from recordings of (B) AMPA-mEPSC, (C) NMDA-mEPSC and (D) GABA-mIPSCs before Reelin application (left), during 5 minutes of Reelin application (middle), after Reelin washout (Right). (E) The mEPSC and mIPSC frequency for AMPA-, NMDA- and GABA-mediated spontaneous events increases in response to Reelin (AMPA n = 6; NMDA n = 8; GABA n = 5). AMPA mEPSC frequency increased from 0.8 ± 0.1 Hz before Reelin to 4.8 ± 0.2 Hz during Reelin and decreased to 0.9 ± 0.2 Hz after Reelin washout. Reelin similarly affected both NMDA- mEPSCs (from 0.7 ± 0.1 Hz before Reelin to 3.2 ± 0.3 Hz during Reelin and 0.7 ± 0.1 Hz after Reelin washout) as well as GABA-mediated mIPSCs (from 0.4 ± 0.04 Hz before Reelin to 1.7 ± 0.1 Hz during Reelin and 0.4 ± 0.1 Hz after Reelin washout) (F) Distribution of AMPA-mEPSC, NMDA-mEPSC and GABA-mIPSC amplitudes before Reelin (Baseline, grey bars) and during Reelin (white bars) application. Overall averages of AMPA mEPSC amplitude showed a slight decrease during Reelin treatment (p < 0.05 paired student’s T-test, n = 7) while NMDA mEPSC amplitude increased (P < 0.01 paired student’s T-test, n = 10). GABA mIPSC amplitudes did not reveal a marked change after Reelin application (p > 0.3, n = 4). All error bars represent standard errors of the mean.
Figure 2
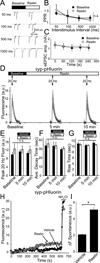
Figure 2. Reelin selectively augments spontaneous SV trafficking without altering the properties of evoked neurotransmission
(A) Example of paired-pulse ratio traces for AMPA receptor mediated events before Reelin and after Reelin application. (B) Paired-pulse ratio before and after Reelin application was unaltered compared to Vehicle control (Vehicle n = 5; Reelin n = 5). (C) Single AP stimulation delivered at 60 s intervals did not alter AMPA-EPSC amplitude in the absence (closed squares) or presence (open diamonds) of Reelin (No Reelin n = 7, Reelin = 13) (D) Optical measurements of cells infected with synaptophysin-pHluorin. Cells were electrically stimulated with 200 APs delivered at 20 Hz before, 5 minutes after, and 10 minutes after Reelin application. (E, F and G) Reelin did not affect 20 Hz stimulation driven fluorescence peak amplitude, decay time or rise time (Vehicle n = 5; Reelin n = 6). (E) Peak fluorescence amplitudes before Vehicle 10.1 ± 0.9 a.u., after 5 minutes in Vehicle 11.4 ± 1.0 a.u., and after 10 minutes in Vehicle 10.7 ± 0.9 a.u., compared to 12.7 ± 2.3 a.u. before Reelin, 12.4 ± 1.7 a.u. after 5 minutes of Reelin application, and 12.3 ± 1.9 a.u. 10 minutes after Reelin application. (F) Fluorescence decay kinetics were not different with 34.5 ± 5.7 s before Vehicle, 34.2 ± 4.8 s 5 minutes after Vehicle, and 30.2 ± 2.1 s after 10 minutes in Vehicle compared to 35.7 ± 3.5 s before Reelin application, 34.6 ± 3.0 s after 5 minutes in Reelin and 32.1 ± 1.8 s after 10 minutes in Reelin. Finally, fluorescence rise time (G) in Reelin was not significantly different from Vehicle (11.3 ± 0.6 s before Vehicle, 10.8 ± 0.4 s after 5 minutes in Vehicle, and 11.6 ± 0.7 10 minutes after Vehicle compared to 11.0 ± 0.4 s before Reelin application, 10.8 ± 0.2 s after 5 minutes in Reelin and 11.0 ± 0.2 s after 10 minutes in Reelin). There were no significant differences between any of the groups, analyzed by ANOVA (p > 0.2 between all groups). (H and I) In the presence of the vacuolar ATPase inhibitor, folimycin, syp-pHluorin fluorescence accumulates reflecting spontaneous vesicle trafficking. (H) Example traces of fluorescence increase in Vehicle (closed circles) and Reelin (open circles) followed by NH4Cl application to visualize the total syp-pHluorin pool. (I) In the presence of Reelin, spontaneous syp-pHluorin fluorescence increased to 5.06 ± 0.24 a.u. after 10 minutes compared to 2.11 ± 0.05 a.u. after 10 minutes in Vehicle (Vehicle, n = 701 synapses from 6 experiments; Reelin, n = 917 synapses from 6 experiments; p-value <0.001). Here and all subsequent figures asterisks denote statistical significance. All error bars represent standard errors of the mean.
Figure 3
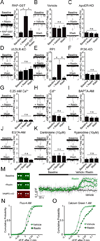
Figure 3. Reelin acts through ApoER2 and VLDLR to activate PI3K and triggers presynaptic Ca2+ signaling
(A) Application of a soluble antagonist for ApoER, GST-RAP, inhibits the Reelin effect. Cell exhibited a robust increase in mEPSC frequnecy (from 1.1 ± 0.2 Hz before Reelin to 4.6 ± 1.2 Hz after Reelin (p < 0.05, n=4), while application of GST-RAP in the presence of Reelin returned mEPSC frequency to near baseline levels (1.5 ± 0.57 Hz) (p > 0.5 compared to baseline). (B) Reelin and not another factor in Reelin culture medium is responsible for the observed increase in spontaneous transmission, as medium lacking Reelin has no effect (2.0 ± 0.7 Hz in Vehicle, compared to 1.8 ± 0.6 Hz after application of Reelin; p > 0.5, n=6) (C) ApoER2 KO cells do not respond to Reelin (1.0 ± 0.2 Hz before Reelin, and 0.9 ± 0.2 Hz after; p > 0.5, n=7) (D) VLDLR KO cells do not respond to Reelin (1.8 ± 0.3 Hz before Reelin, and 2.1 ± 0.5 Hz after; p > 0.3, n=5) (E) The Src kinase inhibitor PP1 leaves the Reelin effect intact (1.4 ± 0.5 Hz before and 8.1 ± 2.5 Hz; p < 0.001, n=6) (F) Reelin requires the activation of PI3K to augment spontaneous transmission as PI3K KO cells do not respond to Reelin (1.2 ± 0.2 Hz before and 1.1± 0.2 Hz after Reelin; p > 0.1, n=5; n=4 for wild type positive controls data not shown). (G, H, I and J) The Reelin effect was attenuated after decreasing the extracellular Ca2+ concentration to 0.25 mM (0.3 ± 0.1 Hz before and 0.2 ± 0.1 Hz after Reelin; p > 0.5, n=7) or addition of Cd2+ (200 µM) to the extracellular solution (2.7 ± 0.8 Hz before and 2.2 ± 0.6 Hz after Reelin; p > 0.5, n=6). Cells incubated in 20 µM BAPTA-AM (0.7 ± 0.2 Hz before Reelin and 0.6 ± 0.2 Hz after Reelin; p > 0.5, n=9) or 10 µM EGTA-AM (1.1 ± 0.2 Hz before and 1.0 ± 0.2 after Reelin application; p > 0.5, n=9) did not respond to Reelin. (K and L) Prior incubation with Dantrolene (10 µM) and Ryanodine (10 µM) also abolished the Reelin effect (1.5 ± 0.4 Hz before and 1.5 ± 0.5 Hz after Reelin and 1.1 ± 0.2 Hz before and 1.1 ± 0.2 Hz after Reelin for Dantrolene (n=6) and Ryanodine (n=9), respectively. In both cases, p > 0.5) (M) Example traces of Calcium Green-1 images identified by co-labeling with the presynaptic marker syb2-mOrange. Scale bar is 5 µm. The presence of negative ΔF/F values are due to baseline fluorescence fluctuations as well as mild photobleaching. (N) Cumulative probability histogram showing Fluo-4 ΔF/F over 2 min in Vehicle (N=5, 410 puncta) and Reelin (N=7, 529 puncta). K-S test shows significance p < 0.0001 with Dmax value = 0.195. (O) Cumulative probability histogram showing Calcium Green-1 ΔF/F over 2 min in vehicle (N=3, 259 synapses) and Reelin (N=4, 309 synapses). K-S test shows significance p < 0.0001, Dmax value = 0.449. Unless noted otherwise, all p-values were calculated using paired Student’s T-test. All error bars represent standard errors of the mean.
Figure 4
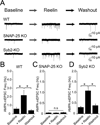
Figure 4. Reelin-induced increase in spontaneous release requires SNAP-25 but not syb2
(A) Example traces of AMPAR mEPSCs from WT, SNAP-25 KO and Syb2 KO neurons. (B, C and D) Reelin increases mEPSC frequency in WT cells (0.6 ± 0.2 Hz before Reelin, 2.2 ± 0.6 Hz during Reelin and 0.4 ± 0.1 Hz after Reelin washout in WT cells; asterisks p < 0.005 ) while SNAP-25 KO cells (C), do not respond to Reelin (0.06 ± 0.01 Hz before Reelin, 0.05 ± 0.02 Hz during Reelin and 0.06 ± 0.00 Hz after Reelin washout; p > 0.5). However, Reelin still caused an increase in mEPSC frequency in syb2 KO cells (D) (0.31 ± 0.04 Hz before Reelin compared to 1.1 ± 0.1 Hz after Reelin application and 0.4 ± 0.1 Hz after washout; p < 0.005). All p-values were calculated by paired Student’s T-test. All error bars represent standard errors of the mean.
Figure 5
Figure 5. Reelin selectively mobilizes a pool of vesicles tagged with VAMP7
(A–D) Example traces of spontaneous pHluorin-tagged SV trafficking in 2 mM Ca2+ followed by application of NH4Cl is shown on left, and quantification of fluorescence change after 10 minutes in Vehicle or Reelin is shown on right. (A) Reelin does not alter syb2-pHluorin trafficking (25.4 ± 0.7 a.u. after 10 minutes for Vehicle compared to 24.9 ± 0.5 a.u. in Reelin; Vehicle: n = 576 synapses, 5 experiments; Reelin: n = 689 synapses 5 experiments; p > 0.5). (B) Reelin does not alter VAMP4-pHluorin trafficking (1.7 ± 0.1 a.u over 10 minutes in Vehicle compared to 1.8 ± 0.2 a.u in Reelin; Vehicle: n = 350 synapses, 4 experiments; Reelin: n = 466 synapses, 5 experiments; p > 0.5). (C) Reelin does not affect vti1a-pHluorin spontaneous trafficking (2.1 ± 0.3 a.u. after 10 minutes in Vehicle compared to 1.9 ± 0.3 a.u. in Reelin; Vehicle: n = 340 synapses, 4 experiments; Reelin: n = 512 synapses, 5 experiments; p > 0.5). (D) VAMP7-pHluroin trafficking is increased more than 2-fold in the presence of Reelin compared to Vehicle (1.4 ± 0.4 a.u. after 10 minutes in vehicle to 3.8 ± 0.3 a.u. in Reelin; Vehicle: n = 209 synapses, 7 experiments; Reelin: n = 263 synapses, 7 experiments; p < 0.001). The p-values reported were calculated by unpaired Student’s T-test. All error bars represent standard errors of the mean.
Figure 6
Figure 6. Dual color analysis of vesicular SNARE trafficking reveals that VAMP7 specifically responds to Reelin application
(A) Neurons were co-infected with syb2-mOrange and vti1a-pHluorin. (Top) Cartoon depicting the segregation of these fluorescent signals to distinct SV pools. (Bottom) Co-localization of syb2-mOrange and vti1a-pHluorin fluorescence within individual synaptic boutons. Arrows indicate representative regions of interest selected for analysis. Scale bars indicate 5 µm. (B) In synapses co-labeled with syb2-mOrange and vti1a-pHluorin, application of Reelin did not alter the trafficking of either vesicular SNARE compared to Vehicle application. (C) In Vehicle syb2-mOrange fluorescence increased to 13.9 ± 0.9 a.u. after 10 minutes in Vehicle compared to 14.1 ± 0.9 a.u. after Reelin application (p > 0.5). In the case of vti1a-pHluorin, during Vehicle application fluorescence reached to 5.3 ± 0.5 a.u. after 10 minutes, whereas in Reelin vti1a-pHluorin fluorescence was leveled at 5.3 ± 0.8 a.u. (Vehicle: n =382 synapses, 5 experiments vs. Reelin: n = 351 synapses, 5 experiments; p > 0.5) (D) Neurons were co-infected with syb2-mOrange and VAMP7-pHluorin. (Top) Cartoon depicting the segregation of these fluorescent signals to distinct SV pools. (Bottom) Co-localization of syb2-mOrange and VAMP7-pHluorin fluorescence within individual synaptic boutons. Arrows indicate representative regions of interest selected for analysis. (E) Reelin selectively enhances VAMP7 trafficking in synapses that co-express syb2-mOrange and VAMP7-pHluorin. (F) During application of Vehicle, syb2-mOrange fluorescence reached to 32.3 ± 1.9 a.u. in 10 minutes. Under the same condition, VAMP7-pHluorin fluorescence reached to 6.4 ± 0.9 a.u. after 10 minutes. In the presence of Reelin, however, syb2-mOrange fluorescence was relatively unaffected (29.9 ± 1.9 a.u. in 10 minutes; p > 0.2), whereas VAMP7-pHluorin fluorescence reached 20.5 ± 1.3 a.u. in 10 minutes (Vehicle: n = 108 synapses, 8 experiments; Reelin n = 77 synapses, 6 experiments; p<0.001). All error bars represent standard errors of the mean.
Figure 7
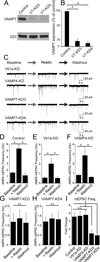
Figure 7. VAMP7 knockdown is necessary and sufficient to abolish the effect of Reelin
(A and B) Immunoblot and quantification of blots for the knockdown (KD) of VAMP7 (n = 4) (KD3 15.2 ± 5.9% of control (p < 0.01) KD4 is 9.3 ± 6.3% (p < 0.01)) in hippocampal neurons. (C) Example traces of AMPAR mEPSCs from, vit1a-KD, VAMP4-KD and two different constructs of VAMP7-KD. (D–H) Quantification of AMPAR mEPSCs data in control cells, and after knockdown of vit1a, VAMP4, and VAMP-7 using two different constructs (VAMP7-KD3 and VAMP7-KD4). (D) In control cells, Reelin resulted in a large increase in spontaneous AMPAR mEPSC frequency (from 1.5 ± 0.2 Hz to 5.2 ± 0.8 Hz during reelin, returning to 1.1 ± 0.4 Hz after washout; p < 0.05) . (E) Cells in which Vti1a was knocked down still responded to reelin (0.6 ± 0.1 Hz in control compared to 2.0 ± 0.5 Hz in the presence of Reelin and 0.50 ± 0.2 Hz after Reelin washout; p < 0.05). (F) Similarly, VAMP-4 knockdown did not alter the Reelin response (0.8 ± 0.1 Hz before Reelin, 2.8 ± 0.7 Hz in the presence of Reelin and 0.6 ± 0.1 Hz after Reelin washout; p < 0.05). (G and H) Cells infected with either VAMP-7 KD construct, -KD3 (G) or -KD4 (H) did not respond to Reelin (0.7 ± 0.2 Hz before Reelin to 0.9 ± 0.3 Hz in the presence of Reelin and 0.6 ± 0.2 after Reelin washout, and 1.3 ± 0.2 Hz prior to Reelin application to 1.5 ± 0.3 Hz during Reelin application and 1.7 ± 0.3 Hz after Reelin washout for VAMP7-KD3 and VAMP7-KD4, respectively (for all conditions in either VAMP7-KD construct, p > 0.2). (I) AMPAR-mEPSC frequency calculated as fold change for Control (3.5 ± 0.5 fold, n = 7), Vti1a-KD (3.6 ± 0.5 fold, n = 8), VAMP4-KD (3.7 ± 0.7 fold, n = 10), VAMP7-KD3 (1.4 ± 0.4 fold, n = 7), and VAMP7-KD4 (1.1 ± 0.1 fold, n = 7) (p <0.05, one-way ANOVA; Holm-Sidak’s post hoc except the difference between Control and VAMP7-KD3 did not reach significance; p = 0.053). All error bars represent standard errors of the mean.

Similar articles

Cited by

References

    1. Alabi AA, Tsien RW. Synaptic vesicle pools and dynamics. Cold Spring Harbor perspectives in biology. 2012;4:a013680. - PMC - PubMed
    1. Alcantara S, Ruiz M, D'Arcangelo G, Ezan F, de Lecea L, Curran T, Sotelo C, Soriano E. Regional and cellular patterns of reelin mRNA expression in the forebrain of the developing and adult mouse. J Neurosci. 1998;18:7779–7799. - PMC - PubMed
    1. Andresen MC, Hofmann ME, Fawley JA. Invited Review: The un-silent majority - TRPV1 drives "spontaneous" transmission of unmyelinated primary afferents within cardiorespiratory NTS. Am J Physiol Regul Integr Comp Physiol. 2012;303:R1207–R1216. - PMC - PubMed
    1. Atasoy D, Ertunc M, Moulder KL, Blackwell J, Chung C, Su J, Kavalali ET. Spontaneous and evoked glutamate release activates two populations of NMDA receptors with limited overlap. J Neurosci. 2008;28:10151–10166. - PMC - PubMed
    1. Autry AE, Adachi M, Nosyreva E, Na ES, Los MF, Cheng PF, Kavalali ET, Monteggia LM. NMDA receptor blockade at rest triggers rapid behavioural antidepressant responses. Nature. 2011;475:91–95. - PMC - PubMed

Publication types

MeSH terms