. 2013 Oct;9(10):e1003911.
doi: 10.1371/journal.pgen.1003911. Epub 2013 Oct 31.

Human intellectual disability genes form conserved functional modules in Drosophila

Affiliations

Human intellectual disability genes form conserved functional modules in Drosophila

Merel A W Oortveld et al. PLoS Genet. 2013 Oct.

Abstract

Intellectual Disability (ID) disorders, defined by an IQ below 70, are genetically and phenotypically highly heterogeneous. Identification of common molecular pathways underlying these disorders is crucial for understanding the molecular basis of cognition and for the development of therapeutic intervention strategies. To systematically establish their functional connectivity, we used transgenic RNAi to target 270 ID gene orthologs in the Drosophila eye. Assessment of neuronal function in behavioral and electrophysiological assays and multiparametric morphological analysis identified phenotypes associated with knockdown of 180 ID gene orthologs. Most of these genotype-phenotype associations were novel. For example, we uncovered 16 genes that are required for basal neurotransmission and have not previously been implicated in this process in any system or organism. ID gene orthologs with morphological eye phenotypes, in contrast to genes without phenotypes, are relatively highly expressed in the human nervous system and are enriched for neuronal functions, suggesting that eye phenotyping can distinguish different classes of ID genes. Indeed, grouping genes by Drosophila phenotype uncovered 26 connected functional modules. Novel links between ID genes successfully predicted that MYCN, PIGV and UPF3B regulate synapse development. Drosophila phenotype groups show, in addition to ID, significant phenotypic similarity also in humans, indicating that functional modules are conserved. The combined data indicate that ID disorders, despite their extreme genetic diversity, are caused by disruption of a limited number of highly connected functional modules.


Conflict of interest statement

The authors have declared that no competing interests exist.

Figures

Figure 1
Figure 1. Large scale screen of Intellectual Disability genes in Drosophila and phenotype distribution.
(A) Screening program. In the primary screen, lethality, phototaxis and external eye morphology were scored. The numbers of Drosophila ID genes and RNAi lines (in brackets) are added in red color at each step. Note that total numbers do not add up, as multiple phenotypes can be assigned to one gene. Secondary assays: Electroretinogram (ERG), Scanning electron microscopy (SEM), histology. Lethal genes (asterisk) were subjected to analysis of lethality upon pan-neuronal ablation. (B) Proof of principle for the phototaxis assay and RNAi approach, using a known blind mutant (norpA, in black), norpA RNAi (vdrc 21490, in dark grey) and a control (in light grey). Distribution of genotypes over the 6 phototaxis vials. PIs are indicated. The severity of phenotypes was norpA>norpA RNAi. The phototaxis device and further proof of principle data are shown in Figure S1. (C) Proof of principle for RNAi-based defects in external eye morphology. Knockdown of Ube3a and da results in the expected loss of bristles and rough eye phenotypes. (D) Distribution of 270 screened ID gene orthologs into phenotype classes. The three indicated classes with morphological defects form the group of eye morphology defective Drosophila ID (EMD-ID) genes. Genes without any phenotype define no eye defect Drosophila ID (NED-ID) genes. All RNAi genotypes and their associated phenotypes are provided in Table S1A.
Figure 2
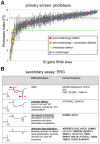
Figure 2. Phototaxis and electrophysiology defects of Drosophila ID models.
(A) Results of phototaxis screen. Average Phototaxis Indexes (PIs) of all assayed RNAi lines. Error bars indicate Standard Deviations in triplicate experiments. Horizontal black dashed line indicates the average PI of the genetic background controls. Green line indicates the threshold defining a phototaxis defect. Note the random distribution of eye morphology defects (in orange and red) along the entire range of PIs. (B) Electroretinogram (ERG) phenotypes of phototaxis defective ID conditions. Three ERG defective categories can be distinguished. Per category, a representative profile and the human ID gene symbols are shown. Genes that have not previously been associated with basal neurotransmission defects are highlighted in bold. The novelty of these data is discussed in Table S2. Red arrowheads indicate the synaptic response (‘on’ and ‘off’ transients). Note the complete absence (Δ) or strong reduction of transients (*) in the mutant conditions. In the latter two categories, also receptor potentials (depolarization) are affected. Genotypes are provided in Table S1B.
Figure 3
Figure 3. Histological analysis of Drosophila ID gene knockdown eyes with ERG defects.
(A) Wildtype pattern of an ommatidia array in a transversal section of a control retina. Arrowhead: pigment cells (A′) Longitudinal section of a single ommatidium, lens to the top. The horizontal line and asterisk mark the level of the transversal section in all other panels. Dark structures (A, A′) are rhabdomeres, the photosensitive domains of Photoreceptors (PRs). (B) Schematic drawing of PR 1–7 in their typical stereotype pattern. PR cytoplasms in light grey. R: rhabdomeres. (C–I) A selection of histological sections of Drosophila ID gene knockdown eyes. Corresponding human gene names are indicated. Genes that have not previously been associated with histological phenotypes are highlighted in bold. The novelty of these data is discussed in Table S2. (C,C′) Transversal and longitudinal sections reveal a TBCE mutant phenotype of developmental origin. Arrowheads: bulky rhabdomeres, arrows: mis-positioned PR8s. (D–F) and genes indicated to their right: neurodegeneration in several ID conditions. Arrows in D point to black photoreceptor cytoplasms, arrowheads to single lost PRs/rhabdomeres. Massive loss of PRs can be seen in panels E and F. (G–I) and genes indicated to their right: structurally intact photoreceptors. Genotypes are provided in Table S1B.
Figure 4
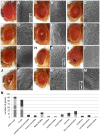
Figure 4. Eye morphology defects of Drosophila ID models.
(A–M) Representative eye morphology defects in Drosophila ID gene knockdown eyes. (A,A′) Wild-type. (B,B′) PNP, mildly rough. (C,C′) ABCD1, rough. (D,D′) RAB39B, ommatidia partially fused, loss of pigmentation and wrinkled surface. (E,E′) MED12, fused ommatidia and loss of pigmentation. (F,F′) AFF2, fewer bristles and rough eyes. (G,G′) FGFR2/3, no bristles. (H,H′) TSC2, long bristles (compare inset H′ to inset A′). (I,I′) TBCE, mildly rough and necrosis. (J,J′) SURF1, loss of pigmentation, necrosis, small eye and fused ommatidia. (K,K′) DMD, small eye, rough, wrinkled surface, long bristles. (L′) ASL, stubble (-like) bristles and fused ommatidia. Bristles are short and thick (compare inset l′ with inset a′). (M′) HSD17B10, rough eye and dented surface. (N) Total number of Drosophila ID genes with the indicated morphologic eye phenotypes. Medium grey bars represent isolated eye phenotypes. Light grey bars represent phenotypes that co-occurred with mildly rough or rough phenotypes. In the case of mildly rough phenotype it indicates co-occurrence with rough, and vice versa. Dark grey bars represent phenotypes that co-occurred with eye phenotypes other than rough or mildly rough. Insets with single magnified bristles in A′, I′ and L′ correspond to a height of 35 mm. Genotypes are provided in Table S1B.
Figure 5
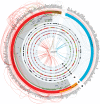
Figure 5. The modular landscape of Intellectual Disability.
Graphic summary of ID genes, phenotypes and features identified in this study. Note the consistent asymmetry of features among EMD- versus NED-ID genes in these datasets. From the periphery to the centre: segment 1. Human gene symbols and reported genetic interactions. 2. Major phenotype classes: EMD (in red), ERG defective (in orange), NED (in blue) and lethal (in brown) phenotypes. 3. EMD categories. Rough (R), mildly rough (MR), long bristles (LoB), (partially) fused ommatidia (F), stubble bristles (SB), fewer bristles (FB), no bristles (NB), small eye, wrinkled/dented surface (SEWDS), loss of pigmentation (P), necrosis (NEC). 4. Black squares: human postsynaptic density proteins (listed in Table S3). 5. Pink squares: genes with their highest relative expression in nerve tissue (see also Figure S2A). 6. Human phenotype ontology features (from HPO database, see Materials and Methods). Red: enriched for Head-Neck/Musculoskeletal features, green: enriched for metabolism, yellow: enriched for both terms. 7. Significantly enriched phenotypes from FlyBase. Purple color represent nervous system related phenotypic terms (neuroanatomy, neurophysiology and photoreceptor) whereas turquoise color represents stress response phenotypes. Dark grey: both enriched. 8. ID genes that contribute to enriched neuronal functions among EMD-ID genes (in red) and enriched metabolic process among NED-ID genes (in green). See Figure S2C,D for a the underlying GO terms. 9. Protein-protein interactions (PPI). PPIs within EMD-, NED-ID and lethal gene products are represented as red, blue and brown colored lines, respectively. Grey lines represent PPI links between EMD or lethal to NED gene products.
Figure 6
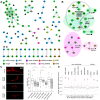
Figure 6. ID modules, proof of predictive value and phenotype coherence across evolution.
(A) Phenotype-based homotypic ID modules. PPIs from HRPD in black, PPIs from human Interologs in turquoise, co-isolated protein complexes in yellow and genetic interactions in green. A high resolution image of Figure 6A is provided as Figure S4. (B) Three examples of homotypic modules that predict novel connections and phenotypes. Dotted lines indicate additional support identified by targeted literature search (see Table S4). (C) The ‘long bristles’ genes MYCN, PIGV and UPF3B are required, as predicted, for normal synapse development of the Drosophila larval Neuromuscular junction (NMJ). Anti-dlg1 labelling in red. The synaptic area (µm2) was quantitatively assessed using an in house-developed Fiji macro. Panels show representative NMJs. Box plots show the quantitative MYCN, PIGV and UPF3B synaptic phenotypes, compared to their appropriate genetic background controls. ** p<0.01; *** p<0.001; two tailed T-test. All phenotypes are highly significant. (D) Phenotypic similarity of human disorders caused by genes in the same fly eye phenotype category. Red crosses indicate the mean within-group phenotype similarity score. Box plots display the distributions of 1000 random controls sampled from the full set of genes in HPO, with the box representing the 25%–75% interquartile range. Asterisks indicate significant within-group phenotype similarity. ** p<0.05; ** p<0.01; *** p<0.001. Eye morphology categories as indicated, whereby “fused” represents fused and partially fused ommatidia, “bristles, others” represents fewer, no and stubble bristles, and SEWDS represents small eye and wrinkled or dented surface. Note that genes associated with ERG defects, lethal, and NED-ID genes (no eye morphology phenotype) also show a high degree of phenotypic coherence in human.

Similar articles

Cited by

References

    1. Ropers HH (2010) Genetics of early onset cognitive impairment. Annu Rev Genomics Hum Genet 11: 161–187. - PubMed
    1. van Bokhoven H (2011) Genetic and Epigenetic Networks in Intellectual Disabilities. Annual Review of Genetics 45: 81–104. - PubMed
    1. Nadif Kasri N, Van Aelst L (2008) Rho-linked genes and neurological disorders. Pflugers Arch 455: 787–797. - PMC - PubMed
    1. Krab LC, Goorden SM, Elgersma Y (2008) Oncogenes on my mind: ERK and MTOR signaling in cognitive diseases. Trends Genet 24: 498–510. - PubMed
    1. Najmabadi H, Hu H, Garshasbi M, Zemojtel T, Abedini SS, et al. (2011) Deep sequencing reveals 50 novel genes for recessive cognitive disorders. Nature 478: 57–63. - PubMed

Publication types

Grants and funding

This work was supported by the BioRange program of the Netherlands Bioinformatics Centre (NBIC http://www.nbic.nl/research, supported by Netherlands Genomics Initiative) to MO and HGB, by VIB, the research fund KU Leuven, an ERC Starting Grant (260678) and FWO grants to PV, by the European Union's FP7 large scale integrated network Gencodys (http://www.gencodys.eu/, HEALTH-241995) to HvB, MAH and AS, and by the German Mental Retardation Network funded by the NGFN+ program of the German Federal Ministry of Education and Research (BMBF), by an NCMLS/RUNMC fellowship, TOP (912-12-109), VIDI (917-96-346) and Aspasia grants from the Netherlands Organization for Scientific Research (NWO) to AS. The funders had no role in study design, data collection and analysis, decision to publish, or preparation of the manuscript.

LinkOut - more resources