. 2013 Oct 30;5(209):209ra153.
doi: 10.1126/scitranslmed.3006802.

A genomics-based classification of human lung tumors

Collaborators

A genomics-based classification of human lung tumors

Clinical Lung Cancer Genome Project (CLCGP) et al. Sci Transl Med. .

Abstract

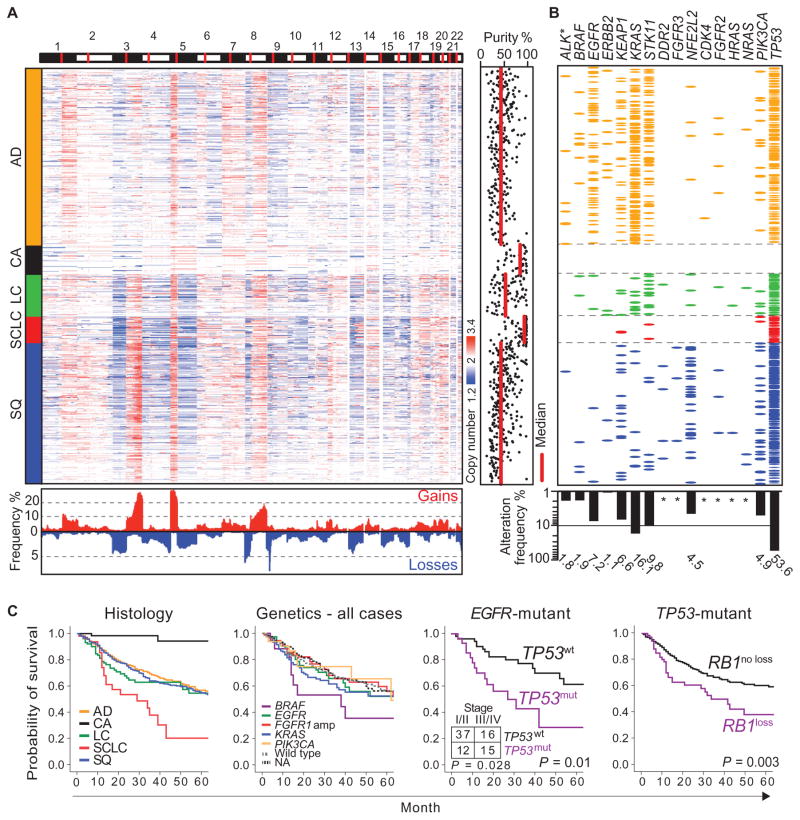
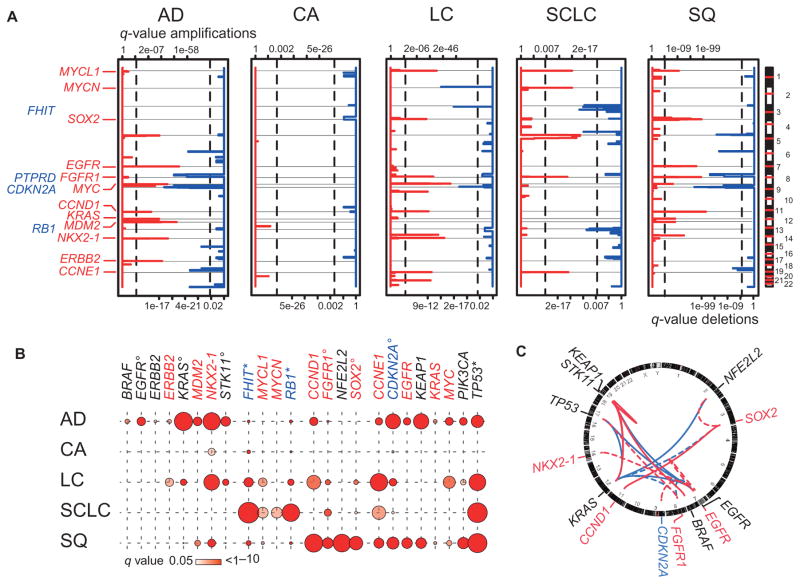
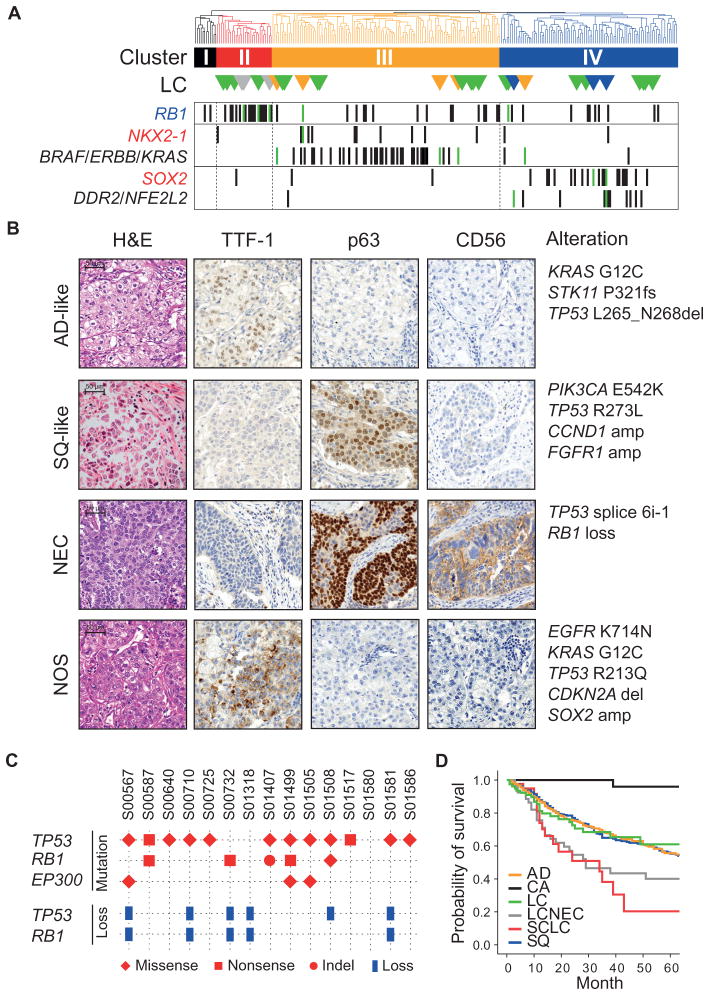
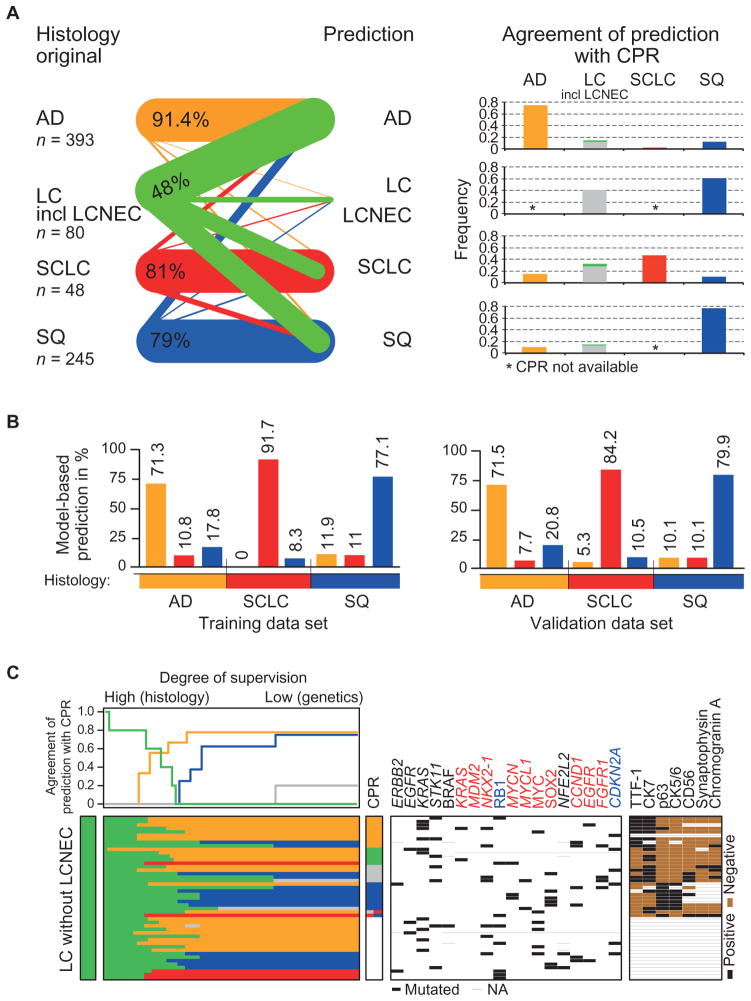
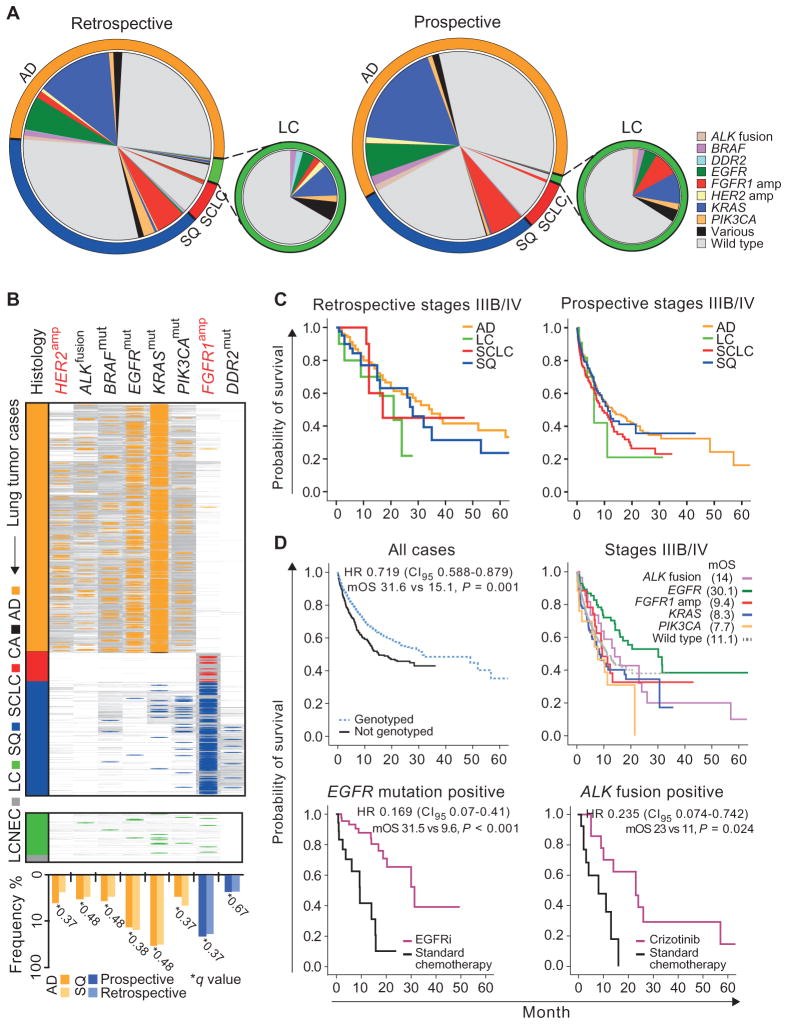
We characterized genome alterations in 1255 clinically annotated lung tumors of all histological subgroups to identify genetically defined and clinically relevant subtypes. More than 55% of all cases had at least one oncogenic genome alteration potentially amenable to specific therapeutic intervention, including several personalized treatment approaches that are already in clinical evaluation. Marked differences in the pattern of genomic alterations existed between and within histological subtypes, thus challenging the original histomorphological diagnosis. Immunohistochemical studies confirmed many of these reassigned subtypes. The reassignment eliminated almost all cases of large cell carcinomas, some of which had therapeutically relevant alterations. Prospective testing of our genomics-based diagnostic algorithm in 5145 lung cancer patients enabled a genome-based diagnosis in 3863 (75%) patients, confirmed the feasibility of rational reassignments of large cell lung cancer, and led to improvement in overall survival in patients with EGFR-mutant or ALK-rearranged cancers. Thus, our findings provide support for broad implementation of genome-based diagnosis of lung cancer.


Conflict of interest statement

Competing interests: R.K.T. is a founder and shareholder of Blackfield AG. R.K.T. received consulting and lecture fees (Sanofi-Aventis, Merck, Roche, Lilly, Boehringer Ingelheim, AstraZeneca, Atlas-Biolabs, Daiichi-Sankyo, and Blackfield AG) as well as research support (Merck, EOS, and AstraZeneca). R.B. is a cofounder and owner of Targos Molecular Diagnostics and received honoraria for consulting and lecturing from AstraZeneca, Boehringer Ingelheim, Merck, Roche, Novartis, Lilly, Qiagen, and Pfizer. J.W. received consulting and lecture fees from Roche, Novartis, Boehringer Ingelheim, AstraZeneca, Bayer, Lilly, Merck, and Amgen and research support from Roche, Bayer, Novartis, and Boehringer Ingelheim. M.L.S. is a fellow of the International Association for the Study of Lung Cancer. M.S. received funds from Lilly, Roche, Boehringer Ingelheim, AstraZeneca, and Pfizer. P.N. is a founder, CEO, and shareholder of ATLAS Biolabs GmbH. W.P. received research funding from Enzon Xcovery, AstraZeneca, Symphogen, Clovis Oncology, and Bristol-Myers Squibb and had paid consulting relationships with Molecular MD, AstraZeneca, Bristol-Myers Squibb, Symphony Evolution, Clovis Oncology, Exelixis, and Clarient. Rights to EGFR T790M testing were licensed on behalf of W.P. and others by Memorial Sloan-Kettering Cancer Center to Molecular MD. M.P. is a founder and shareholder of Blackfield AG, J.H.C. is a member of the Advisory Board of Boehringer Ingelheim Pharma GmbH & Co KG. H.G. is a member of the Advisory Boards of Roche, Eli Lilly, and Pfizer. H.-U.S. has an advisory relationship with Roche, Abbott Molecular, and Pfizer and has received honoraria from Novartis, Roche, Abbott Molecular, and Pfizer. B.S. is a member of the Advisory Boards for Pfizer, Novartis, Roche, Boehringer Ingelheim, and AstraZeneca. J.W. is a member of the Advisory Boards for Novartis, Roche, AstraZeneca, Boehringer Ingelheim, Lilly, Bristol-Myers Squibb, and Bayer and has received speaking fees from Novartis, Roche, AstraZeneca, Boehringer Ingelheim, and Lilly and research support from Roche, Boehringer Ingelheim, Novartis, and Bayer. T.Z. has performed advisory work for Merck, Lilly, Amgen, Roche, and Boehringer Ingelheim. D.B. is a member of regional advisory boards for Roche, Lilly, and Boehringer Ingelheim. F.L. received consulting fees from Blackfield AG. S.M.-B. received honoraria and grants from Roche and Novartis. L.N. received speaking fees from Roche and Novartis and honoraria from Pfizer. M.D.W. had paid consulting relationships with GeneCentric Cancer Therapeutics Innovation Group.

Figures

Fig. 1
Fig. 1. A global view of the lung cancer genome
(A) Copy number profiles of lung cancer specimens of the major histological subtypes (n = 992) (red, increases; blue, decreases) are plotted along the genome (horizontal axis: chromosomes as indicated, centromeres in red). Vertical colored bars on the left indicate lung cancer subtypes. Bottom: The frequencies (y axis) of copy number gains (red; cutoff, 2.7) and losses (blue; cutoff, 1.3) across all samples, calculated for adjoining 1-Mb fragments using segmented copy number data, are represented along the genome. Purity of tumor samples determined through SNP array–derived copy number data (26) is shown on the right, with the median purity calculated for each histological subgroup indicated in red. (B) Mutations and ALK rearrangements (ALK*) are depicted per sample per gene as colored ellipses. Sample order was conserved from (A), and colors were chosen consistent with lung cancer subtypes. Total mutation frequencies per gene expressed as a percentage of all cases are shown as a bar graph at the bottom. Frequencies below 1% are marked with an asterisk. (C) Kaplan-Meier curves for overall survival are shown for the overall population per histological subtype (LC includes LCNEC), per genotype, for EGFR-mutant cases according to their TP53 mutation status, and for TP53-mutant cases according to their RB1 alteration status (from left to right) (P values for survival were calculated using the log-rank test). Numbers of cases with wild-type (wt) and mutant (mut) TP53 in early stages (I and II) and late stages (III and IV) are given for EGFR-mutant cases (inset; P value was calculated using the Pearson χ2 test). Color code for histology: orange, AD; black, CA; green, LC (including LCNEC); red, SCLC; blue, SQ.
Fig. 2
Fig. 2. Genomic alterations in histological subgroups of lung cancer
(A) Significantly amplified (red) and deleted (blue) regions calculated using a rank sum–based algorithm (24) are plotted along the genome (y axis) for the five major lung cancer subtypes [AD (n = 421), CA (n = 69), LC (n = 101), SCLC (n = 63), and SQ (n = 338)]. Statistical significance, expressed by q values (x axes: amplification, upper scale; deletion, lower scale), was computed for each genomic location. Known or potential oncogenes (red) or tumor suppressor genes (blue) are given at respective locations. Vertical lines indicate level of significance of q = 0.01. (B) Frequencies of significant genomic alterations are given per gene per histological subtype. Colors of gene names are encoded as follows: red, amplified; blue, deleted; and black, mutated. Frequencies of alterations correspond to circle size [frequencies of deletions of FHIT and RB1 and mutations in TP53 were adapted by dividing values by three (asterisks); frequencies of mutations in EGFR, KRAS, and STK11, of deletions in CDKN2A, and of amplifications in FGFR1 and SOX2 were adapted by dividing values by two (circles)]. Significant mutations were determined using a binomial test with a background mutation rate of 0.5%. P values were adjusted for multiple hypothesis testing using the Benjamini and Hochberg method across each histological subtype. q values of significant results (q < 0.05) are indicated by the color code of the symbols (color key provided below the chart). (C) Associations of copy number alterations and mutations calculated using Fisher’s exact test followed by Benjamini and Hochberg adjustment are represented with a Circos plot. Involved genes are named at corresponding genomic locations (copy number gains in red, copy number deletions in blue, and mutations in black) outside the ring representing the genome. Internal lines show significant co-occurring (red) and mutually exclusive (blue) events (q < 0.05) between two copy number alterations or two frequently mutated genes (solid lines) or between a copy number alteration and a mutation (dashed lines) found in lung cancer.
Fig. 3
Fig. 3. Genetic features typical of other lung cancer subtypes in LC
(A) Unsupervised hierarchical clustering using 294 highly variable (SD/mean >2.1) expressed genes identified four gene expression subgroups containing mainly CA (I), SCLC (II), AD (III), and SQ (IV). LC samples are indicated as triangles at corresponding positions below the cluster dendrogram. They are colored orange if they have AD-specific alterations, blue if they have SQ-specific alterations, gray if the case was initially diagnosed as an LCNEC, and green if they have no known alteration. Genetic alterations (label: red, amplified; blue, deleted; black, mutated; ERBB includes mutation in EGFR or ERBB2) are given for selected genes per sample as vertical lines (LC cases in green; others in black). (B) Typical immunohistochemistry is shown for LC specimens with immunohistochemical and genetic characteristics of AD (AD-like), SQ (SQ-like), and NEC, as well as LC lacking features of other lung cancer subtypes (NOS, not otherwise specified). The corresponding genetic alterations are indicated on the right. H&E, hematoxylin and eosin. (C) Distribution of mutations (in red, symbols according to type of mutation: diamond for missense, square for nonsense, and circle for indel) and copy number loss (in blue) of TP53, RB1, and EP300 across all whole exome–sequenced LCNECs. (D) Overall survival corresponding to each histological lung cancer subtype, with LC separated into LCs with neuroendocrine (gray) and without neuroendocrine (green) features.
Fig. 4
Fig. 4. Genomics-based classification of lung cancer
(A) Semisupervised reclassification of lung tumor samples. The relative proportion of cases per histological subtype (left; the LC group includes LCNEC cases) that were reclassified on the basis of 18 genetic alterations (table S11) to a certain subgroup (labels in the middle) is illustrated as lines. The weight of the lines is proportional to the fraction of cases classified to the respective subgroup. All cases that were predicted to be LC were histological LCNEC. Bars in the right graph give the concordance of each predicted class with the central pathological review (CPR). Subtypes for which no CPR was available are denoted with asterisks. (B) Supervised in silico classification of lung cancer specimens based ongeneticfeatures for 637 tumor samples with at least one genetic alteration and validation of the classifier in independent data sets of all three subgroups (20, 21, 25). Original histological subtypes defined groups for supervised learning. Bars indicate classification frequencies relative to the original histology. Classification results for the CLCGP data set are shown on the left, and results of the three validation data sets are on the right. (C) Semi-supervised genetics-based reclassification of LC specimens without neuroendocrine features. For each sample (rows), prediction to a certain subtype (color per row in accordance to the color code used for histological subtypes, see below) is given (lower graph). Degree of supervision (x axis, upper graph) decreases continuously from left to right, the farthest right representing a genetics-based prediction. Agreement of the prediction with the CPR is plotted for each stage of supervision (upper part). Detailed information is given in Supplementary Materials and Methods. Genome alterations (black lines) and immunohistochemistry results (black, positive; brown, negative; thin gray line, not available) are indicated for each sample (middle and right panels). Genes are sorted according to their predictive value for histological subtypes. For the cases in the lower part of the figure, immunohistochemistry was not performed. Color code for predicted classes and CPR: orange, AD; black, CA; green, LC; gray, LCNEC; red, SCLC; blue, SQ; combination of colors, mixed subtype; white, no CPR.
Fig. 5
Fig. 5. Clinically relevant genome alterations in lung cancer subtypes
(A) Genetic alterations per histological subtype in retrospective and prospective sample sets. Each chart represents the overall population with proportions of histological subtypes color-coded in the outer ring. Frequencies of alterations (wild type: no alteration in ALK, EGFR, FGFR1, KRAS, or PIK3CA) are given per gene relative to all cases within each histological subtype. Distribution of alterations for the LC population is shown separately. (B) Genotyping results of 3590 patients enrolled in the prospective screening effort are sorted according to the histological subtype [AD (2250), CA (3), SCLC (265), SQ (1018), LC (47), and LCNEC (7)]. Colored lines indicate alterations, and gray lines indicate wild type. Frequencies of alterations for AD (orange) and SQ (blue) are plotted below the respective genes, comparing the mutation frequency in the prospective data set (dark colors) to the retrospective data set (light colors). No significant difference between the data sets was seen (q values are given on the graph; P values were adjusted for multiple hypothesis testing using the Benjamini and Hochberg method). Color code: orange, AD; black, CA; green, LC; gray, LCNEC; red, SCLC; blue, SQ. (C) Kaplan-Meier curves for overall survival are shown for stage IIIB/IV patients per histological subtype for the retrospective (left) and prospective (right) sample sets. No significant difference was seen between subtypes within each data set. (D) Prospective sample set: Kaplan-Meier curves for overall survival are shown for all patients who were genetically tested versus those without available genetic information (top left). Overall survival is shown for stage IIIB/IV patients with alterations in given genes versus patients with wild type in the given genes (top right). Overall survival was statistically significantly longer in EGFR-mutant cases compared to all other (log-rank test, P < 0.05) except ALK-rearranged cases (P = 0.065). Overall survival is shown for patients with EGFR mutation treated with an EGFR inhibitor or standard chemotherapy (bottom left) and patients with ALK translocations treated with crizotinib or standard chemotherapy (bottom right). Gain of overall survival in the patient group treated with kinase inhibitors versus standard chemotherapy is given by the median overall survival (mOS). P values were corrected using the Bonferroni adjustment. HR, hazard ratio.

Comment in

Similar articles

Cited by

References

    1. Travis W, Brambilla E, Mueller-Hermelink H, Harris C. World Health Organization Classification of Tumours. Pathology and Genetics: Tumours of the Lung, Pleura, Thymus and Heart. World Health Organization; Geneva: 2004.
    1. Travis WD, Brambilla E, Noguchi M, Nicholson AG, Geisinger K, Yatabe Y, Powell CA, Beer D, Riely G, Garg K, Austin JH, Rusch VW, Hirsch FR, Jett J, Yang PC, Gould M. American Thoracic Society, International Association for the Study of Lung Cancer/ American Thoracic Society/European Respiratory Society: International multidisciplinary classification of lung adenocarcinoma: Executive summary. Proc Am Thorac Soc. 2011;8:381–385. - PubMed
    1. Lynch TJ, Bell DW, Sordella R, Gurubhagavatula S, Okimoto RA, Brannigan BW, Harris PL, Haserlat SM, Supko JG, Haluska FG, Louis DN, Christiani DC, Settleman J, Haber DA. Activating mutations in the epidermal growth factor receptor underlying responsiveness of non–small-cell lung cancer to gefitinib. N Engl J Med. 2004;350:2129–2139. - PubMed
    1. Paez JG, Jänne PA, Lee JC, Tracy S, Greulich H, Gabriel S, Herman P, Kaye FJ, Lindeman N, Boggon TJ, Naoki K, Sasaki H, Fujii Y, Eck MJ, Sellers WR, Johnson BE, Meyerson M. EGFR mutations in lung cancer: Correlation with clinical response to gefitinib therapy. Science. 2004;304:1497–1500. - PubMed
    1. Pao W, Girard N. New driver mutations in non-small-cell lung cancer. Lancet Oncol. 2011;12:175–180. - PubMed

Publication types