

Proteomic analysis for Type I interferon antagonism of Japanese encephalitis virus NS5 protein
- PMID: 24166946
- PMCID: PMC7167617
- DOI: 10.1002/pmic.201300001
Proteomic analysis for Type I interferon antagonism of Japanese encephalitis virus NS5 protein
Abstract
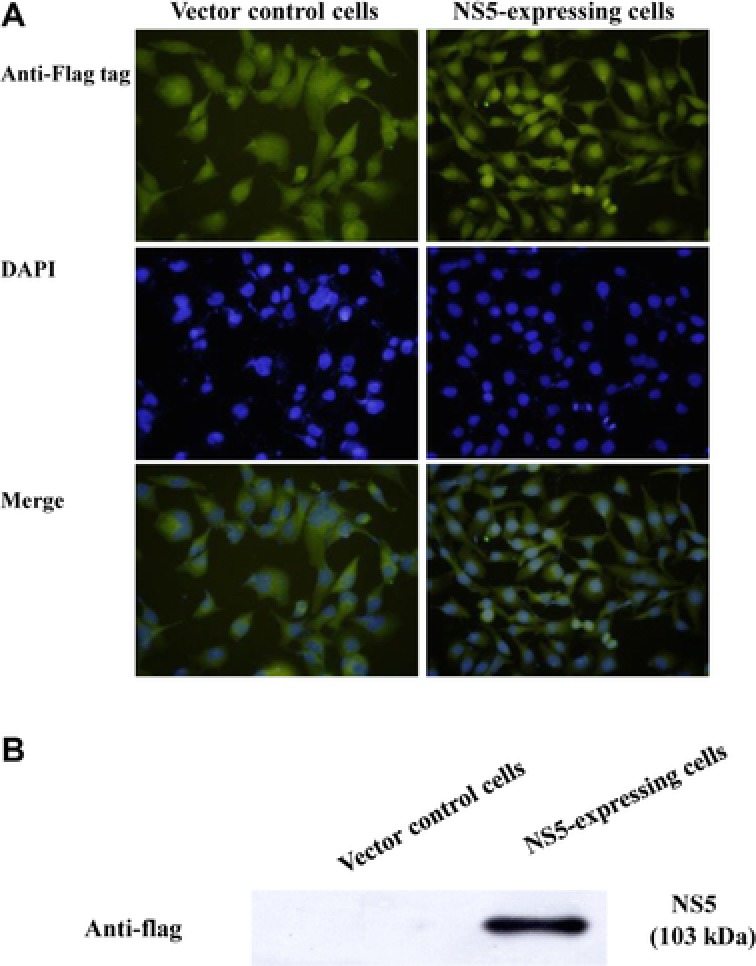
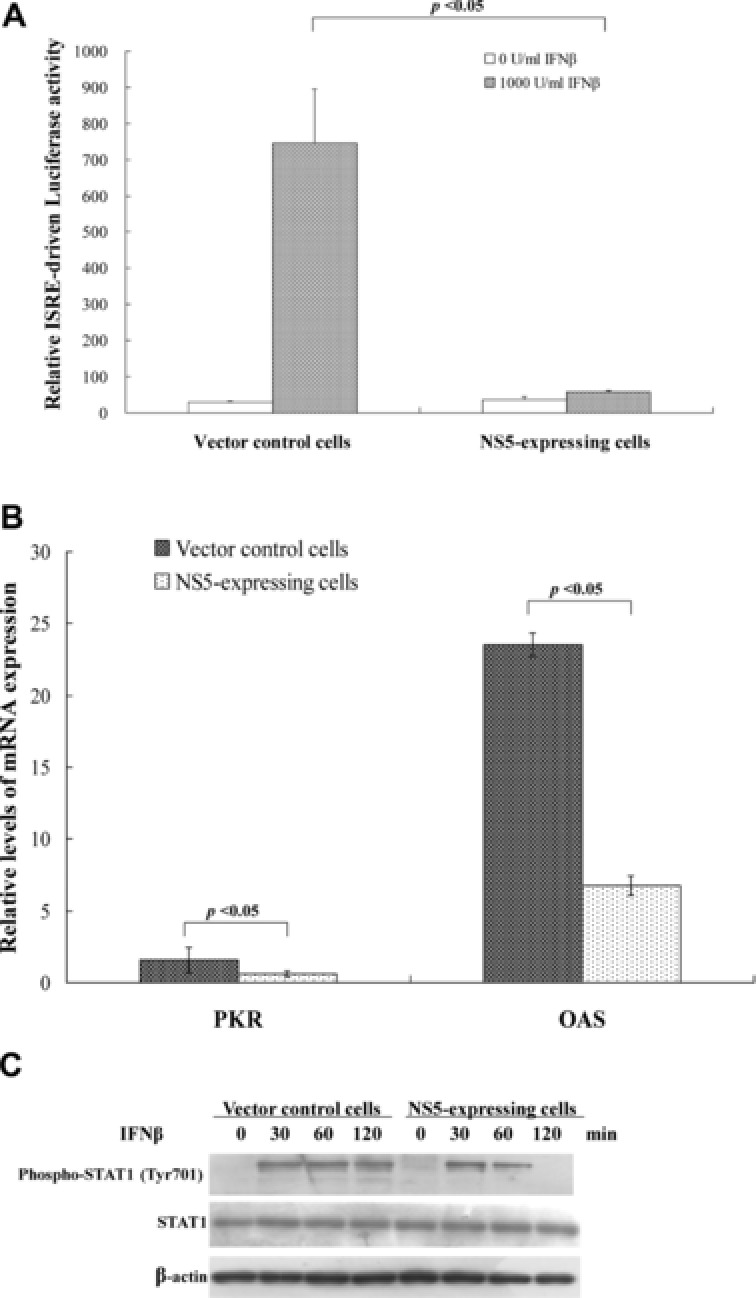
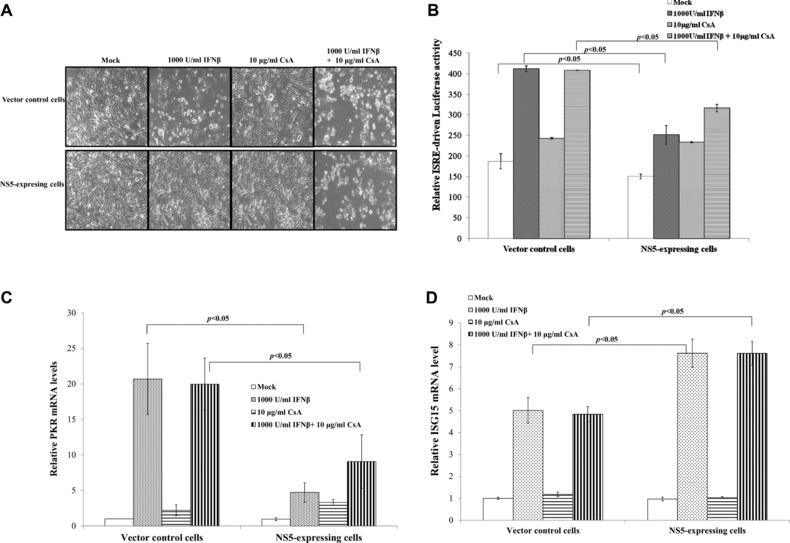
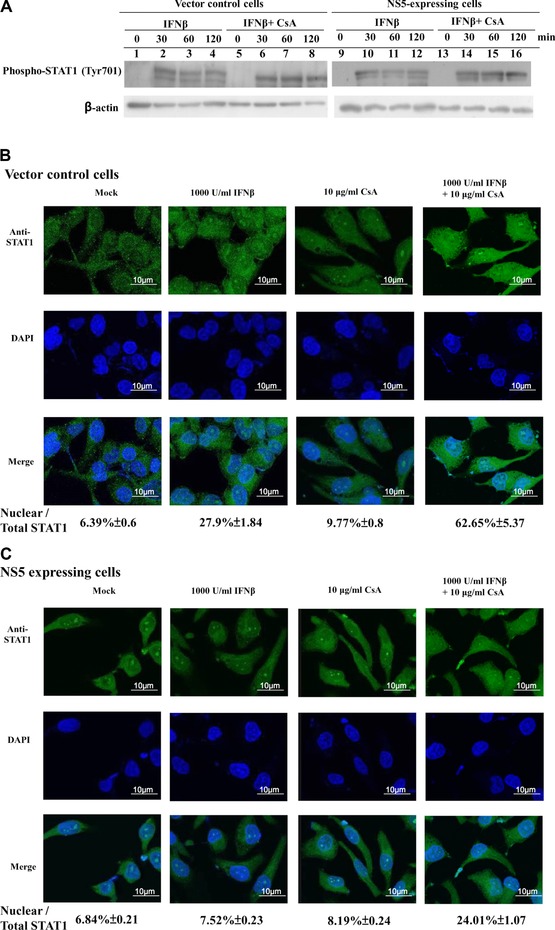
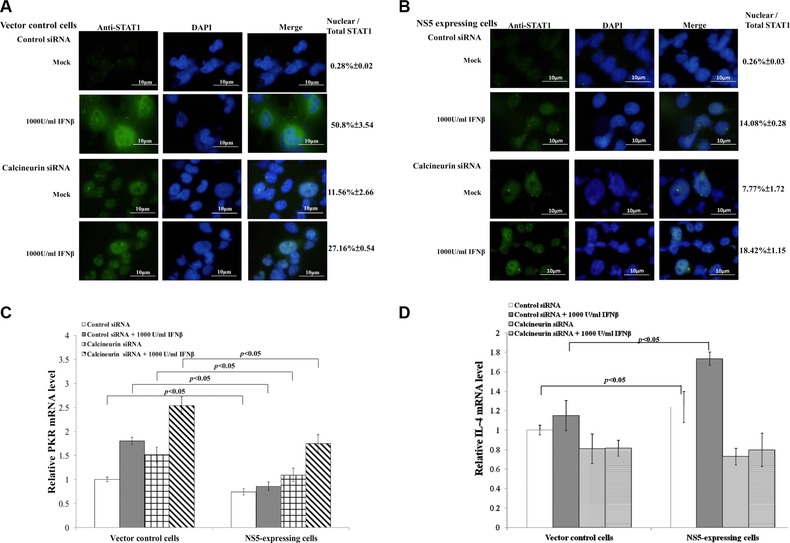
Japanese encephalitis virus (JEV) nonstructural protein 5 (NS5) exhibits a Type I interferon (IFN) antagonistic function. This study characterizes Type I IFN antagonism mechanism of NS5 protein, using proteomic approach. In human neuroblastoma cells, NS5 expression would suppress IFNβ-induced responses, for example, expression of IFN-stimulated genes PKR and OAS as well as STAT1 nuclear translocation and phosphorylation. Proteomic analysis showed JEV NS5 downregulating calreticulin, while upregulating cyclophilin A, HSP 60 and stress-induced-phosphoprotein 1. Gene silence of calreticulin raised intracellular Ca(2+) levels while inhibiting nuclear translocalization of STAT1 and NFAT-1 in response to IFNβ, thus, indicating calreticulin downregulation linked with Type I IFN antagonism of JEV NS5 via activation of Ca(2+) /calicineurin. Calcineurin inhibitor cyclosporin A attenuated NS5-mediated inhibition of IFNβ-induced responses, for example, IFN-sensitive response element driven luciferase, STAT1-dependent PKR mRNA expression, as well as phosphorylation and nuclear translocation of STAT1. Transfection with calcineurin (vs. control) siRNA enhanced nuclear translocalization of STAT1 and upregulated PKR expression in NS5-expressing cells in response to IFNβ. Results prove Ca(2+) , calreticulin, and calcineurin involvement in STAT1-mediated signaling as well as a key role of JEV NS5 in Type I IFN antagonism. This study offers insights into the molecular mechanism of Type I interferon antagonism by JEV NS5.
Keywords: Calreticulin; Interferon; Japanese encephalitis virus; Microbiology; Non-structural protein 5; STAT1.
© 2013 WILEY-VCH Verlag GmbH & Co. KGaA, Weinheim.
Figures
Similar articles
-
Japanese Encephalitis Virus NS5 Inhibits Type I Interferon (IFN) Production by Blocking the Nuclear Translocation of IFN Regulatory Factor 3 and NF-κB.J Virol. 2017 Mar 29;91(8):e00039-17. doi: 10.1128/JVI.00039-17. Print 2017 Apr 15. J Virol. 2017. PMID: 28179530 Free PMC article.
-
Blocking of interferon-induced Jak-Stat signaling by Japanese encephalitis virus NS5 through a protein tyrosine phosphatase-mediated mechanism.J Virol. 2006 Jun;80(12):5908-18. doi: 10.1128/JVI.02714-05. J Virol. 2006. PMID: 16731929 Free PMC article.
-
Anti-apoptotic activity of Japanese encephalitis virus NS5 protein in human medulloblastoma cells treated with interferon-β.J Microbiol Immunol Infect. 2018 Aug;51(4):456-464. doi: 10.1016/j.jmii.2017.01.005. Epub 2017 May 19. J Microbiol Immunol Infect. 2018. PMID: 28559152
-
NS5-V372A and NS5-H386Y variations are responsible for differences in interferon α/β induction and co-contribute to the replication advantage of Japanese encephalitis virus genotype I over genotype III in ducklings.PLoS Pathog. 2020 Sep 3;16(9):e1008773. doi: 10.1371/journal.ppat.1008773. eCollection 2020 Sep. PLoS Pathog. 2020. PMID: 32881988 Free PMC article.
-
Inhibition of interferon-stimulated JAK-STAT signaling by a tick-borne flavivirus and identification of NS5 as an interferon antagonist.J Virol. 2005 Oct;79(20):12828-39. doi: 10.1128/JVI.79.20.12828-12839.2005. J Virol. 2005. PMID: 16188985 Free PMC article.
Cited by
-
Antiviral Activity of a Novel Compound CW-33 against Japanese Encephalitis Virus through Inhibiting Intracellular Calcium Overload.Int J Mol Sci. 2016 Aug 24;17(9):1386. doi: 10.3390/ijms17091386. Int J Mol Sci. 2016. PMID: 27563890 Free PMC article.
-
Mosquito-borne flaviviruses and type I interferon: catch me if you can!Front Microbiol. 2023 Oct 30;14:1257024. doi: 10.3389/fmicb.2023.1257024. eCollection 2023. Front Microbiol. 2023. PMID: 37965539 Free PMC article. Review.
-
Phage display technique identifies the interaction of severe acute respiratory syndrome coronavirus open reading frame 6 protein with nuclear pore complex interacting protein NPIPB3 in modulating Type I interferon antagonism.J Microbiol Immunol Infect. 2017 Jun;50(3):277-285. doi: 10.1016/j.jmii.2015.07.002. Epub 2015 Jul 31. J Microbiol Immunol Infect. 2017. PMID: 26320399 Free PMC article.
-
Contributions of Ubiquitin and Ubiquitination to Flaviviral Antagonism of Type I IFN.Viruses. 2021 Apr 27;13(5):763. doi: 10.3390/v13050763. Viruses. 2021. PMID: 33925296 Free PMC article. Review.
-
SARS Coronavirus Papain-Like Protease Inhibits the TLR7 Signaling Pathway through Removing Lys63-Linked Polyubiquitination of TRAF3 and TRAF6.Int J Mol Sci. 2016 May 5;17(5):678. doi: 10.3390/ijms17050678. Int J Mol Sci. 2016. PMID: 27164085 Free PMC article.
References
-
- Burke, D. S. , Monath, T. P. , Flaviviruses, in: Fields B. N., Knipe D. M., Howley P. M., Griffin D. E. (Eds.), Fields Virology, Vol. 4, Lippincott Williams and Wilkins, Philadelphia, PA, 2001, pp. 1043–1125.
-
- Lindenbach, B. D. , Rice, C. M. , Flaviviridae: the viruses and their replication, in: Knipe D. M., Howley P. M. (Eds.), Fields Virology, Vol. 4. Lippincott Williams & Wilkins, Philadelphia, PA, 2001, pp. 991–1041.
-
- Kalita, J. , Misra, U. K. , Comparison of CT and MRI findings in the diagnosis of Japanese encephalitis. J. Neurol. Sci. 2000, 174, 3–8. - PubMed
-
- Misra, U. K. , Kalita, J. , Goel, D. , Mathur, A. , Clinical, radiological and neurophysiological spectrum of JEV encephalitis and other non‐specific encephalitis during post‐monsoon period in India. Neurol. India. 2003, 51, 55–59. - PubMed
-
- Liu, T. H. , Liang, L. C. , Wang, C. C. , Liu, H. C. , Chen, W. J. , The blood‐brain barrier in the cerebrum is the initial site for the Japanese encephalitis virus entering the central nervous system. J. Neurovirol. 2008, 14, 514–521. - PubMed
Publication types
MeSH terms
Substances
LinkOut - more resources
Full Text Sources
Other Literature Sources
Research Materials
Miscellaneous
