

doi: 10.1093/nar/gkt940.
Epub 2013 Oct 22.
PDBsum additions
Affiliations
- PMID: 24153109
- PMCID: PMC3965036
- DOI: 10.1093/nar/gkt940
Item in Clipboard
PDBsum additions
Nucleic Acids Res.
2014 Jan.
Abstract
PDBsum, http://www.ebi.ac.uk/pdbsum, is a website providing numerous pictorial analyses of each entry in the Protein Data Bank. It portrays the structural features of all proteins, DNA and ligands in the entry, as well as depicting the interactions between them. The latest features, described here, include annotation of human protein sequences with their naturally occurring amino acid variants, dynamic graphs showing the relationships between related protein domain architectures, analyses of ligand binding clusters across different experimental determinations of the same protein, analyses of tunnels in proteins and new search options.
Figures
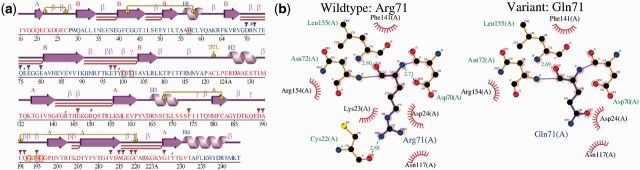
Natural human variants for human coagulation factor Xa mapped onto the 3D structure of the protein in PDB entry 2p16. (a) The protein’s ‘wiring diagram’ is annotated with small lightning bolt images to show residues that, according to the 1000 Genomes data, have natural variants (R71 and R150 in this case). The colouring of the protein’s sequence represents the two structural domains, whereas the purple lines, helices and arrows depict the secondary structures: coil, α-helix and β-strand, respectively. The UniProtKB, Pfam and the Ensembl gene identifier references are given above the diagram and the full set of variants listed to the left (not shown). In (b) are shown two LigPlot diagrams of the interactions of the wild-type and the mutated residue with the surrounding protein residues. The left diagram shows the interactions made by the wild-type residue, Arg71, and the right diagram shows those of the variant, Gln71. The residue of interest is drawn with purple bonds, the interacting residues being drawn in orange. Hydrogen bonds are represented by green dotted lines and residues interacting via non-bonded contact are shown as red eyelashes.
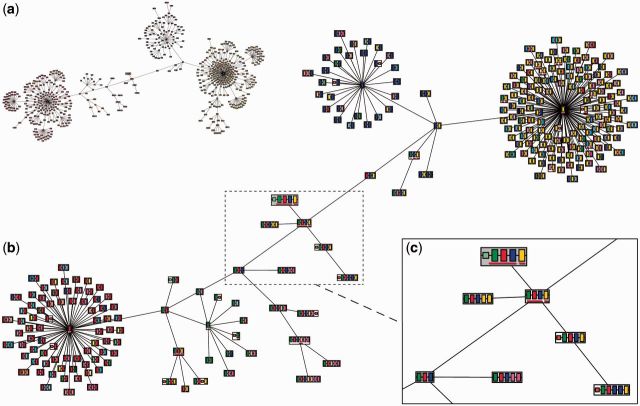
An ArchSchema domain architecture network for coagulation factor Xa from Homo sapiens, PDB entry 2p16. (a) The initial network shows 622 domain architectures (i.e. sequences of Pfam domains), each represented by a different node on the graph. There are over 5500 domain architecture with one of more domains in common with that of coagulation factor Xa, but the graph is automatically trimmed to show only the closest relatives. (b) The same graph, but trimmed via the ArchSchema controls to remove the more distant nodes. (c) A blow-up of the central section of the trimmed graph. Here one can see the sequences of individual Pfam domains, as depicted by the coloured boxes inside each node—taller boxes corresponding to Pfam-A domains and smaller ones to Pfam-B. The node representing coagulation factor Xa is the slightly larger box with a grey background at the top of the inset. Red lines underneath domains indicate there is at least one entry containing the domain in the PDB. (Clicking on the node and then on the proteins marked with a green tick takes you to the structures). Satellite nodes can be added to the plots by selecting the type required: UniProtKB sequence identifiers, PDB identifiers or enzyme classes.

The target summary provided by DrugPort for the drug apixaban, showing its protein target, coagulation factor Xa. The table shows the UniProt identifier and a schematic diagram of the protein’s Pfam domains (as coloured cylinders). The PDB entries of the protein are represented by the purple schematic diagrams of their secondary structure (the spring-like regions representing α-helices and the arrows corresponding to β-strands). These give an idea of the structural coverage given by the PDB entry and, in this case, one can clearly see that only the trypsin domain has been solved. The red border round the thumbnail for Target 1 indicates that the PDB structures are of the drug molecule bound to that target. The schematic diagrams indicate the residue positions in the protein where the drug molecule binds. Various links are given by the little row of icons in the table headers, including a link to an ArchSchema network (Figure 2) and a ligand cluster analysis (the blue and green superposed molecules) described in the main text.

The tunnels calculated for PDB entry 2p16, excluding ligands. The tunnels are the coloured shapes embedded in the grey secondary structure representation of the protein. The table on the right shows various properties for each tunnel, the colours of the balls in the table corresponding to the colours in the image.
Similar articles
-
PDBsum: summaries and analyses of PDB structures.Nucleic Acids Res. 2001 Jan 1;29(1):221-2. doi: 10.1093/nar/29.1.221. Nucleic Acids Res. 2001. PMID: 11125097 Free PMC article.
-
PDBsum more: new summaries and analyses of the known 3D structures of proteins and nucleic acids.Nucleic Acids Res. 2005 Jan 1;33(Database issue):D266-8. doi: 10.1093/nar/gki001. Nucleic Acids Res. 2005. PMID: 15608193 Free PMC article.
-
PDBsum extras: SARS-CoV-2 and AlphaFold models.Protein Sci. 2022 Jan;31(1):283-289. doi: 10.1002/pro.4238. Epub 2021 Nov 24. Protein Sci. 2022. PMID: 34779073 Free PMC article.
-
PDBsum: Structural summaries of PDB entries.Protein Sci. 2018 Jan;27(1):129-134. doi: 10.1002/pro.3289. Epub 2017 Oct 27. Protein Sci. 2018. PMID: 28875543 Free PMC article.
-
The use of protein-ligand interaction fingerprints in docking.Curr Opin Drug Discov Devel. 2008 May;11(3):356-64. Curr Opin Drug Discov Devel. 2008. PMID: 18428089 Review.
Cited by
-
In Silico Structure Prediction of Human Fatty Acid Synthase-Dehydratase: A Plausible Model for Understanding Active Site Interactions.Bioinform Biol Insights. 2016 Aug 14;10:143-54. doi: 10.4137/BBI.S38317. eCollection 2016. Bioinform Biol Insights. 2016. PMID: 27559295 Free PMC article.
-
Characterization of the Proteins Involved in the DNA Repair Mechanism in M. smegmatis.Int J Mol Sci. 2020 Jul 29;21(15):5391. doi: 10.3390/ijms21155391. Int J Mol Sci. 2020. PMID: 32751237 Free PMC article.
-
MANET 3.0: Hierarchy and modularity in evolving metabolic networks.PLoS One. 2019 Oct 24;14(10):e0224201. doi: 10.1371/journal.pone.0224201. eCollection 2019. PLoS One. 2019. PMID: 31648227 Free PMC article.
-
In silico and in vitro analysis of boAP3d1 protein interaction with bovine leukaemia virus gp51.PLoS One. 2018 Jun 21;13(6):e0199397. doi: 10.1371/journal.pone.0199397. eCollection 2018. PLoS One. 2018. PMID: 29928016 Free PMC article.
-
S-adenosylmethionine synthases in plants: Structural characterization of type I and II isoenzymes from Arabidopsis thaliana and Medicago truncatula.Int J Biol Macromol. 2020 May 15;151:554-565. doi: 10.1016/j.ijbiomac.2020.02.100. Epub 2020 Feb 11. Int J Biol Macromol. 2020. PMID: 32057875 Free PMC article.
References
-
- Berman HM, Henrick K, Nakamura H. Announcing the worldwide Protein Data Bank. Nat. Struct. Biol. 2003;10:980. - PubMed
-
- Laskowski RA, Hutchinson EG, Michie AD, Wallace AC, Jones ML, Thornton JM. PDBsum: a Web-based database of summaries and analyses of all PDB structures. Trends Biochem. Sci. 1997;22:488–490. - PubMed
-
- Laskowski RA. Enhancing the functional annotation of PDB structures in PDBsum using key figures extracted from the literature. Bioinformatics. 2007;23:1824–1827. - PubMed
Publication types
MeSH terms
Substances
Grants and funding
LinkOut - more resources
Full Text Sources
Other Literature Sources
Molecular Biology Databases
