

PRC2 binds active promoters and contacts nascent RNAs in embryonic stem cells
- PMID: 24141703
- PMCID: PMC3839660
- DOI: 10.1038/nsmb.2700
PRC2 binds active promoters and contacts nascent RNAs in embryonic stem cells
Abstract
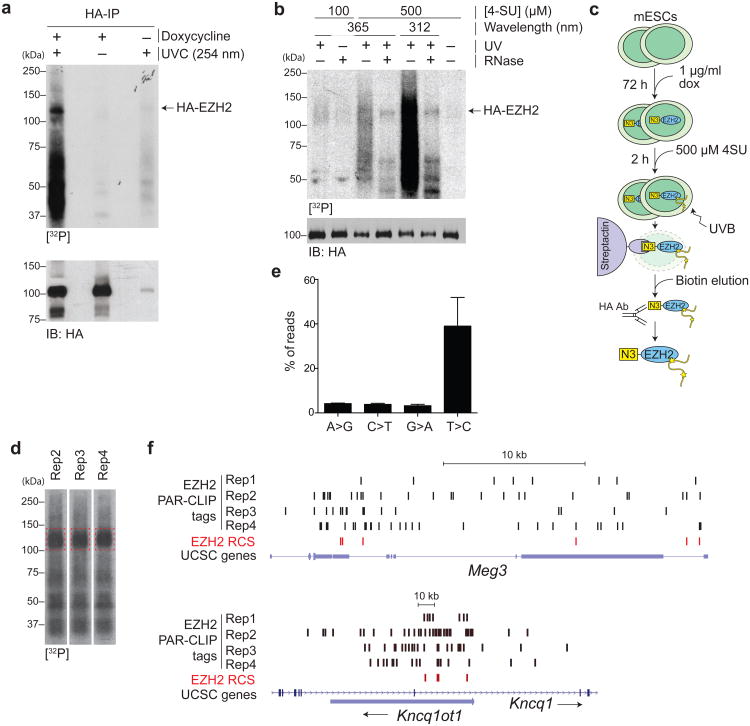
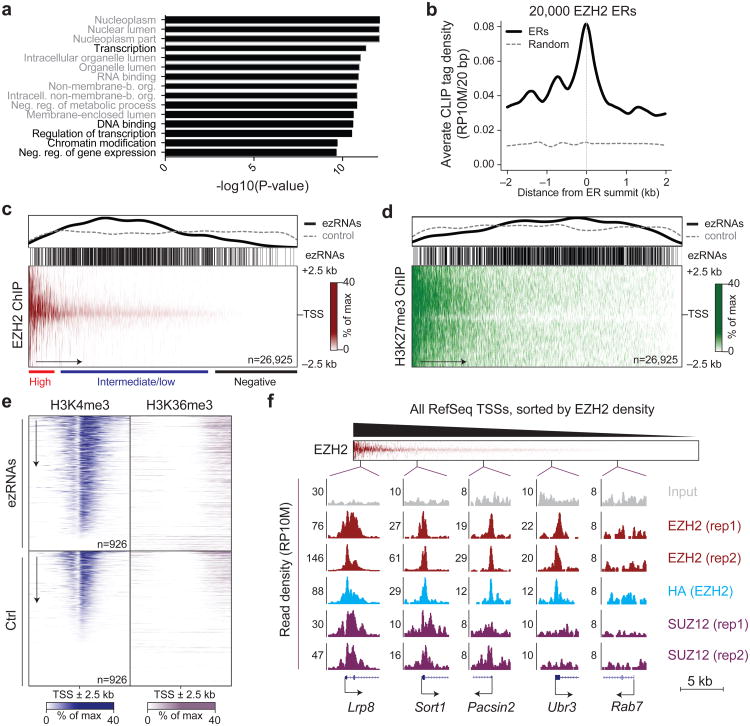
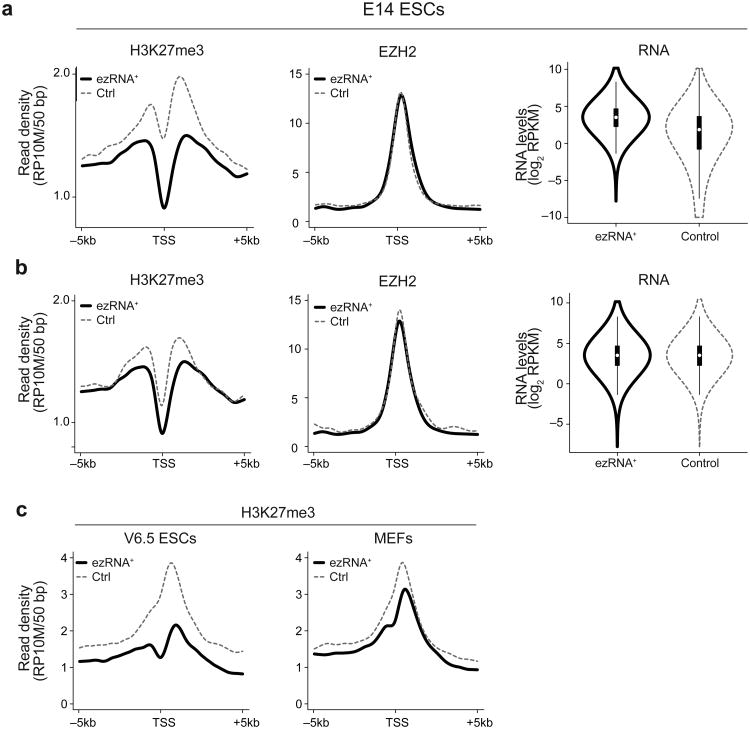
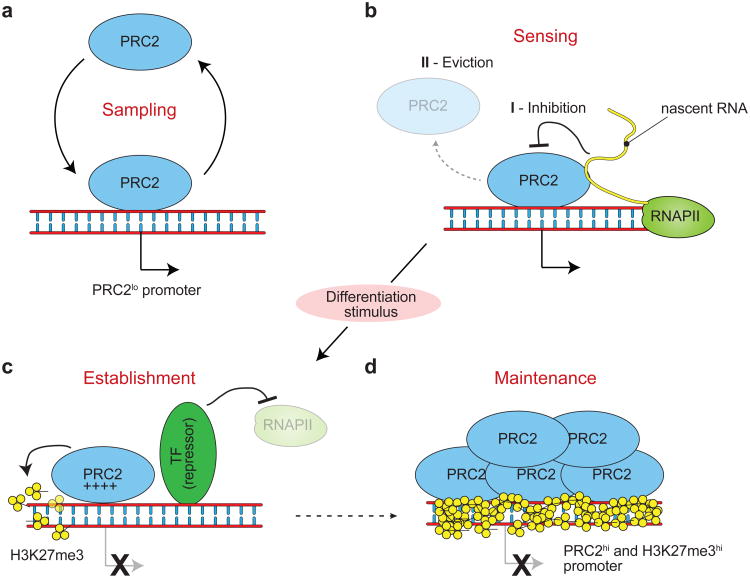
EZH2 is the catalytic subunit of PRC2, a central epigenetic repressor essential for development processes in vivo and for the differentiation of embryonic stem cells (ESCs) in vitro. The biochemical function of PRC2 in depositing repressive H3K27me3 marks is well understood, but how it is regulated and directed to specific genes before and during differentiation remains unknown. Here, we report that PRC2 binds at low levels to a majority of promoters in mouse ESCs, including many that are active and devoid of H3K27me3. Using in vivo RNA-protein cross-linking, we show that EZH2 directly binds the 5' region of nascent RNAs transcribed from a subset of these promoters and that these binding events correlate with decreased H3K27me3. Our findings suggest a molecular mechanism by which PRC2 senses the transcriptional state of the cell and translates it into epigenetic information.
Figures

Comment in
-
Poly-combing the genome for RNA.Nat Struct Mol Biol. 2013 Dec;20(12):1344-6. doi: 10.1038/nsmb.2728. Nat Struct Mol Biol. 2013. PMID: 24304912
Similar articles
-
MicroRNA-323-3p regulates the activity of polycomb repressive complex 2 (PRC2) via targeting the mRNA of embryonic ectoderm development (Eed) gene in mouse embryonic stem cells.J Biol Chem. 2013 Aug 16;288(33):23659-65. doi: 10.1074/jbc.M113.475608. Epub 2013 Jul 2. J Biol Chem. 2013. PMID: 23821546 Free PMC article.
-
Genome-wide analysis identifies a functional association of Tet1 and Polycomb repressive complex 2 in mouse embryonic stem cells.Genome Biol. 2013 Aug 29;14(8):R91. doi: 10.1186/gb-2013-14-8-r91. Genome Biol. 2013. PMID: 23987249 Free PMC article.
-
Polycomb Repressive Complex 2 regulates lineage fidelity during embryonic stem cell differentiation.PLoS One. 2014 Oct 21;9(10):e110498. doi: 10.1371/journal.pone.0110498. eCollection 2014. PLoS One. 2014. PMID: 25333635 Free PMC article.
-
The Complexity of PRC2 Subcomplexes.Trends Cell Biol. 2019 Aug;29(8):660-671. doi: 10.1016/j.tcb.2019.05.004. Epub 2019 Jun 6. Trends Cell Biol. 2019. PMID: 31178244 Review.
-
Polycomb repressive complex 2 in embryonic stem cells: an overview.Protein Cell. 2010 Dec;1(12):1056-62. doi: 10.1007/s13238-010-0142-7. Epub 2011 Jan 8. Protein Cell. 2010. PMID: 21213100 Free PMC article. Review.
Cited by
-
Polycomb repressive complex 2 controls cardiac cell fate decision via interacting with RNA: Promiscuously or well-ordered.Front Genet. 2022 Oct 14;13:1011228. doi: 10.3389/fgene.2022.1011228. eCollection 2022. Front Genet. 2022. PMID: 36313464 Free PMC article. Review.
-
Systematic identification and characterization of long intergenic non-coding RNAs in fetal porcine skeletal muscle development.Sci Rep. 2015 Mar 10;5:8957. doi: 10.1038/srep08957. Sci Rep. 2015. PMID: 25753296 Free PMC article.
-
Long Non-Coding RNAs in Liver Cancer and Nonalcoholic Steatohepatitis.Noncoding RNA. 2020 Aug 29;6(3):34. doi: 10.3390/ncrna6030034. Noncoding RNA. 2020. PMID: 32872482 Free PMC article. Review.
-
The deubiquitinase Usp9x regulates PRC2-mediated chromatin reprogramming during mouse development.Nat Commun. 2021 Mar 25;12(1):1865. doi: 10.1038/s41467-021-21910-0. Nat Commun. 2021. PMID: 33767158 Free PMC article.
-
Regulation of chromatin structure and cell fate by R-loops.Transcription. 2016 Aug 7;7(4):121-6. doi: 10.1080/21541264.2016.1198298. Epub 2016 Jun 21. Transcription. 2016. PMID: 27327157 Free PMC article. Review.
References
-
- Ringrose L, Paro R. Epigenetic regulation of cellular memory by the Polycomb and Trithorax group proteins. Annu Rev Genet. 2004;38:413–443. - PubMed
-
- Cao R, et al. Role of histone H3 lysine 27 methylation in Polycomb-group silencing. Science. 2002;298:1039–1043. - PubMed
-
- Czermin B, et al. Drosophila enhancer of Zeste/ESC complexes have a histone H3 methyltransferase activity that marks chromosomal Polycomb sites. Cell. 2002;111:185–196. - PubMed
Publication types
MeSH terms
Substances
Associated data
- Actions
Grants and funding
LinkOut - more resources
Full Text Sources
Other Literature Sources
Molecular Biology Databases
