. 2013 Nov 20;80(4):900-13.
doi: 10.1016/j.neuron.2013.07.052. Epub 2013 Oct 17.

Chronic cellular imaging of entire cortical columns in awake mice using microprisms

Affiliations

Chronic cellular imaging of entire cortical columns in awake mice using microprisms

Mark L Andermann et al. Neuron. .

Abstract

Two-photon imaging of cortical neurons in vivo has provided unique insights into the structure, function, and plasticity of cortical networks, but this method does not currently allow simultaneous imaging of neurons in the superficial and deepest cortical layers. Here, we describe a simple modification that enables simultaneous, long-term imaging of all cortical layers. Using a chronically implanted glass microprism in barrel cortex, we could image the same fluorescently labeled deep-layer pyramidal neurons across their entire somatodendritic axis for several months. We could also image visually evoked and endogenous calcium activity in hundreds of cell bodies or long-range axon terminals, across all six layers in visual cortex of awake mice. Electrophysiology and calcium imaging of evoked and endogenous activity near the prism face were consistent across days and comparable with previous observations. These experiments extend the reach of in vivo two-photon imaging to chronic, simultaneous monitoring of entire cortical columns.


Figures

Figure 1
Figure 1. Superficial and deep cortical layers imaged in a single plane using a microprism
A. Illustration of beam path through a prism implanted into neocortex. The reflective hypotenuse of the prism converts the horizontal imaging plane into a vertical plane. B. Left: Widefield epifluorescence image of a 1 mm prism implanted in visual cortex, focused 1 mm below the cortical surface. Fluorescent expression of AAV-GCaMP3 can be seen through the cranial window (arrow), and through the prism. Right: Two-photon image taken through the same prism (maximum intensity projection across 15 minutes of recording) at 205 µm lateral to the microprism imaging face, 21 days after prism implant. C. Laminar locations were obtained from post-mortem histological sections of GCaMP3 expression (left) and Nissl stain (right) after removal of the prism (black triangular hole; original imaging path indicated by arrows). D. Anatomical images of cortex taken though a prism at different times after surgery in a Thy1-YFP mouse. Within the first hour after prism insertion, cell bodies in layers 2/3 and 5, and neuronal processes throughout the cortical depth, are visible in a single frame taken 200 microns lateral from the prism face (left panel). An increase in imaging quality over time can be seen on the same population of layer 5 neurons at 29 and 68 days after surgery (middle and right panel, respectively. Images are maximum projections over 76 frames taken from 40 microns to 270 microns lateral to the prism face.). E. Histological section of hematoxylyn and eosin (H&E) staining after removal of prism. F. Tissue morphology appears normal at distances of more than 150 µm from the prism face. H&E staining and brightfield illumination show that cell density is slightly changed proximal to the prism face (left border). Staining for astrocytes (GFAP) and microglia (CD11b) appears normal at 27 days after implant. G. With increasing distance from the prism face, cell density first increases, then decreases, and reaches normal amounts within the first 150 µm. For each of 7 samples, cell counts were normalized to those from 400–500 µm from the prism. Error bars, standard error. See also Figure S1 and Movie S1.
Figure 2
Figure 2. Comparison of cortical neuron responses prior to and following prism implant
A. Brightfield image through a cranial window, prior to and 4 days after prism implant (see also Figure S2). B. Two-photon imaging of GCaMP3 expression in awake mouse primary visual cortex (V1) in the same field of view (dashed box in A), 2 days prior to and 1 day after prism implant (depth: 103 µm). C. Polar plots of normalized visual responses to 16 directions of motion in 3 example neurons at varying distances from the prism face, across 4 sessions (2 days prior, and 1, 4 and 5 days after prism implant). Peak response amplitudes (% ΔF/F) noted at bottom right. D. Comparison of direction preference (top panel), direction selectivity (middle panel) and peak response amplitude (lower panel) for all responsive neurons with reliable direction preference, 2 days prior and 1 day after implant. E. None of the differences in response properties prior to vs. after prism implant varied with the neurons’ distance from the prism face. F. The absolute change in direction preference from 2 days prior to 1, 4 or 5 days after implant was smaller than the sampling resolution of 22.5°. Average direction selectivity (G) increased across sessions, while peak amplitude (H) and number of responsive neurons (with measurable direction preference, I) decreased after prism implant. Sample numbers in F–H (indicated on each bar) include all neurons significantly driven both prior to and on a given day after prism implant, while numbers in G include all responsive neurons (with measurable direction preference) during any given session. Error bars, standard error.
Figure 3
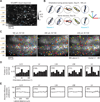
Figure 3. Long-term imaging of orientation preference across all cortical layers in awake mouse V1
Neural activity was imaged through a microprism at 1 Hz across all cortical layers during presentation of visual stimuli. A. Maximum intensity projection of fractional change in GCaMP3 fluorescence (ΔF/F), computed across a stack of average visual response maps for each of 96 stimulus conditions. Data were collected 23 days after prism implant, 180 µm from the prism face. Visually responsive neurons (white spots) were evident in all cortical layers. Bright signal (ΔF/F) at lower left is due to very low baseline fluorescence (F) in that region of the image. B. Neurons across all cortical layers (numbered in blue in A) showed sharp orientation tuning that was consistent at days 21 and 23 following prism implant. Orientation tuning curves are averaged across stimulus locations, spatial and temporal frequencies, and normalized by peak response. Colored lines and colored inset in polar plots indicate estimates of orientation preference (see Experimental Procedures). These five neurons had strong responses in both sessions, exceeding 30% ΔF/F for the preferred orientation. C. Such estimates were used to generate orientation preference maps across cortical layers, across imaging sessions (on days 21, 24, and 27 following prism implant) at three distances from the prism face (180 µm, 205 µm, 230 µm). D. Layer-specific population analyses (numbers in parentheses) from these data, together with three additional sessions from another mouse, revealed distributions of orientation preference with typical biases towards cardinal orientations (Roth et al., 2012). E. The mean absolute difference in orientation preference did not depend on the horizontal distance between neurons, extending previous imaging findings of a lack of clustering for orientation preference in rodent V1 (e.g. Ohki et al., 2005, Kerlin et al., 2010) to deeper cortical layers. N indicates the median number of cell pairs in each layer across the 9 bins (bin size: 50 µm). See also Movie S2.
Figure 4
Figure 4. A coarse retinotopic map exists in all cortical layers of awake mouse V1
Retinotopic preference for the location of the Gabor-like drifting grating stimuli (positioned at a more central location (~45°) or a more peripheral location (~65°), plotted for the same imaging sessions and neurons described in Figure 3C. Preference index: (Rcentral – Rperipheral)/(Rcentral + Rperipheral). These data extend previous findings of fine-scale scatter but coarse retinotopic progression to deeper layers of mouse V1 (Bonin et al., 2011; Smith and Hausser, 2010). See also Movie S2.
Figure 5
Figure 5. Microprism imaging of neural activity in long-range axons of V1 projection neurons
To image long-range cortico-cortical axonal arbors in awake mice through a prism (Glickfeld et al., 2013), AAV-GCaMP3 was injected into area V1 and a microprism was subsequently inserted at the site of V1 innervation of posteromedial secondary visual area PM. A. Two-photon imaging (100 µm from the prism face, 200–275 µm deep, 10 days after prism implant) of baseline GCaMP3 fluorescence in long-range V1 axons (thin white lines) and putative V1 axonal boutons (small white spots) in area PM. B. Fluorescence activation (white) of two axonal arbors in this field of view during two representative endogenous events (average of 2 seconds of data). ΔF: Change in fluorescence, in arbitrary units. C. Fluorescence time courses (4 Hz) of endogenous activity from segments of the two axons (blue an green squares in A and B). D–F. Robust visually evoked activity was observed in V1 axonal boutons innervating deeper layers of area PM (480–510 µm below the cortical surface) in the same mouse (1 day post-implant). D. Response maps to upwards drifting stimuli varying in spatial and temporal frequency, as in Glickfeld et al., 2013. Distinct boutons (white spots) were activated by different visual stimuli. Purple square at top left: Maximum intensity projection of all response maps; colored arrows point to 3 active boutons. E. Spatial-temporal frequency receptive fields (evoked response to each stimulus condition in D) for each of these 3 boutons. F. Associated time courses demonstrated robust single-trial responses to visual stimulation (gray bars), no fluorescence cross-talk, and little photobleaching (not shown). See also Movie S3.
Figure 6
Figure 6. Simultaneous cellular imaging of running-related changes in activity across all cortical layers
Rapid endogenous dynamics of cortical activity was imaged at 32 Hz across entire cortical columns in awake mice that were free to run on a linear trackball in near-complete darkness. The series of images recorded in a 20 minute session was downsampled to 16 Hz and co-registered (see Experimental Procedures). A. Maximum intensity of GCaMP3 fluorescence across the entire recording at ~140 µm from the prism face. The image has been rotated by 150° so that layer 2/3 is at the top and layer 6 is at the bottom. B. Over 200 neurons in the field-of-view were endogenously active and were monitored simultaneously across layers, as shown in a maximum intensity projection across the entire recording after normalization to median fluorescence, (F(t) − Fmedian)/Fmedian. C. Time courses of four of the simultaneously recorded neurons (one in layer 2/3 and three in deep layers; corrected for neuropil contamination). Pink shading indicates bouts of locomotion. Some neurons were active during locomotion, while others were more active during rest. D. Time courses for all 208 simultaneously recorded neurons, plotted together with bouts of running (pink blocks at top). E. Change in GCaMP3 fluorescence, between the 2 s prior to and 2–3 s after locomotion onset. Black regions indicate neurons whose endogenous activity is suppressed by running, white regions indicate neurons activated by locomotion. F. Diverse changes in neural activity at running onset were observed across cortical layers, including many deep-layer neurons exhibiting strong running-induced suppression. Fractional change in GCaMP3 fluorescence at running onset, (Frun − Fstill)/Fstill, where Fstill is the average fluorescence in the 2 s prior to locomotion onset and Frun is the fluorescence from 4–6 s after locomotion onset. Black dots: paired t-test, p < .05; dark gray dots: p < .05/208, light grey dots: all other neurons. G. For six of these neurons, endogenous activity is plotted for all 53 individual locomotion onset trials (depth from left to right: 288 µm, 554 µm, 581 µm, 642 µm, 643 µm, 688 µm. Note that a neuron’s activity could be highly variable across trials. H. Despite this high trial-to-trial variability, pairs of neurons within and across layers did not show consistently strong co-variation in activity across trials (Pearson’s correlation). See also Movies S4 and S5.

Similar articles

Cited by

  • Technologies for imaging neural activity in large volumes.
    Ji N, Freeman J, Smith SL. Ji N, et al. Nat Neurosci. 2016 Aug 26;19(9):1154-64. doi: 10.1038/nn.4358. Nat Neurosci. 2016. PMID: 27571194 Free PMC article. Review.
  • Neurophotonic tools for microscopic measurements and manipulation: status report.
    Abdelfattah AS, Ahuja S, Akkin T, Allu SR, Brake J, Boas DA, Buckley EM, Campbell RE, Chen AI, Cheng X, Čižmár T, Costantini I, De Vittorio M, Devor A, Doran PR, El Khatib M, Emiliani V, Fomin-Thunemann N, Fainman Y, Fernandez-Alfonso T, Ferri CGL, Gilad A, Han X, Harris A, Hillman EMC, Hochgeschwender U, Holt MG, Ji N, Kılıç K, Lake EMR, Li L, Li T, Mächler P, Miller EW, Mesquita RC, Nadella KMNS, Nägerl UV, Nasu Y, Nimmerjahn A, Ondráčková P, Pavone FS, Perez Campos C, Peterka DS, Pisano F, Pisanello F, Puppo F, Sabatini BL, Sadegh S, Sakadzic S, Shoham S, Shroff SN, Silver RA, Sims RR, Smith SL, Srinivasan VJ, Thunemann M, Tian L, Tian L, Troxler T, Valera A, Vaziri A, Vinogradov SA, Vitale F, Wang LV, Uhlířová H, Xu C, Yang C, Yang MH, Yellen G, Yizhar O, Zhao Y. Abdelfattah AS, et al. Neurophotonics. 2022 Jan;9(Suppl 1):013001. doi: 10.1117/1.NPh.9.S1.013001. Epub 2022 Apr 27. Neurophotonics. 2022. PMID: 35493335 Free PMC article.
  • Advantages, Pitfalls, and Developments of All Optical Interrogation Strategies of Microcircuits in vivo.
    Papaioannou S, Medini P. Papaioannou S, et al. Front Neurosci. 2022 Jun 28;16:859803. doi: 10.3389/fnins.2022.859803. eCollection 2022. Front Neurosci. 2022. PMID: 35837124 Free PMC article. Review.
  • Transparent and flexible low noise graphene electrodes for simultaneous electrophysiology and neuroimaging.
    Kuzum D, Takano H, Shim E, Reed JC, Juul H, Richardson AG, de Vries J, Bink H, Dichter MA, Lucas TH, Coulter DA, Cubukcu E, Litt B. Kuzum D, et al. Nat Commun. 2014 Oct 20;5:5259. doi: 10.1038/ncomms6259. Nat Commun. 2014. PMID: 25327632 Free PMC article.
  • Imaging of Leukocyte Trafficking in Alzheimer's Disease.
    Pietronigro E, Zenaro E, Constantin G. Pietronigro E, et al. Front Immunol. 2016 Feb 15;7:33. doi: 10.3389/fimmu.2016.00033. eCollection 2016. Front Immunol. 2016. PMID: 26913031 Free PMC article. Review.

References

    1. Adesnik H, Scanziani M. Lateral competition for cortical space by layer-specific horizontal circuits. Nature. 2010;464:1155–1160. - PMC - PubMed
    1. Amir W, Carriles R, Hoover EE, Planchon TA, Durfee CG, Squier JA. Simultaneous imaging of multiple focal planes using a two-photon scanning microscope. Opt Lett. 2007;32:1731–1733. - PubMed
    1. Andermann ML, Kerlin AM, Reid RC. Chronic cellular imaging of mouse visual cortex during operant behavior and passive viewing. Front. Cell. Neurosci. 2010;4:1–16. - PMC - PubMed
    1. Andermann ML, Kerlin AM, Roumis DK, Glickfeld LL, Reid RC. Functional specialization of mouse higher visual cortical areas. Neuron. 2011;72:1025–1039. - PMC - PubMed
    1. Antonini A, Fagiolini M, Stryker MP. Anatomical correlates of functional plasticity in mouse visual cortex. J Neurosci. 1999;19:4388–4406. - PMC - PubMed

Publication types

MeSH terms

LinkOut - more resources