

Transcriptional establishment of cell-type identity: dynamics and causal mechanisms of T-cell lineage commitment
- PMID: 24135716
- PMCID: PMC3990665
- DOI: 10.1101/sqb.2013.78.020271
Transcriptional establishment of cell-type identity: dynamics and causal mechanisms of T-cell lineage commitment
Abstract
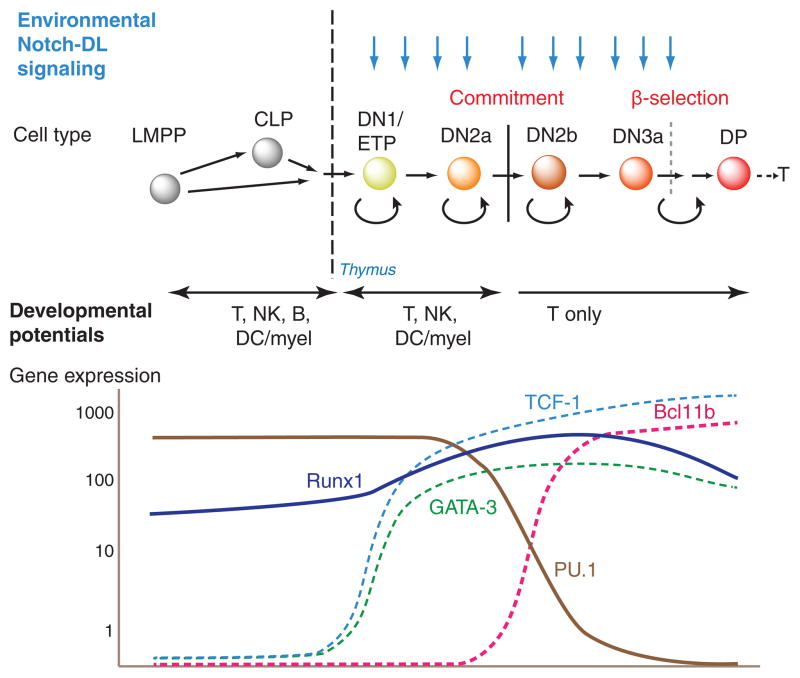
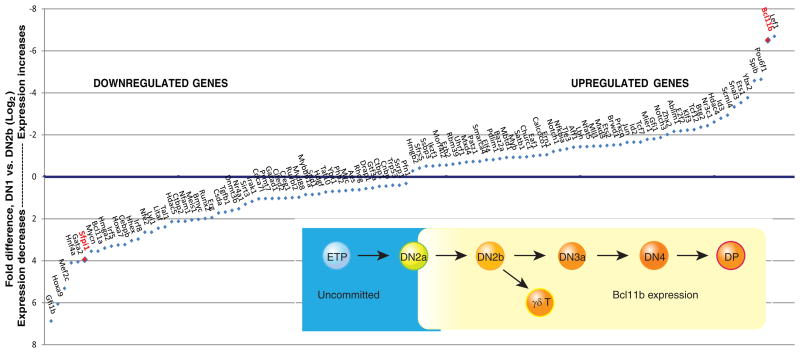
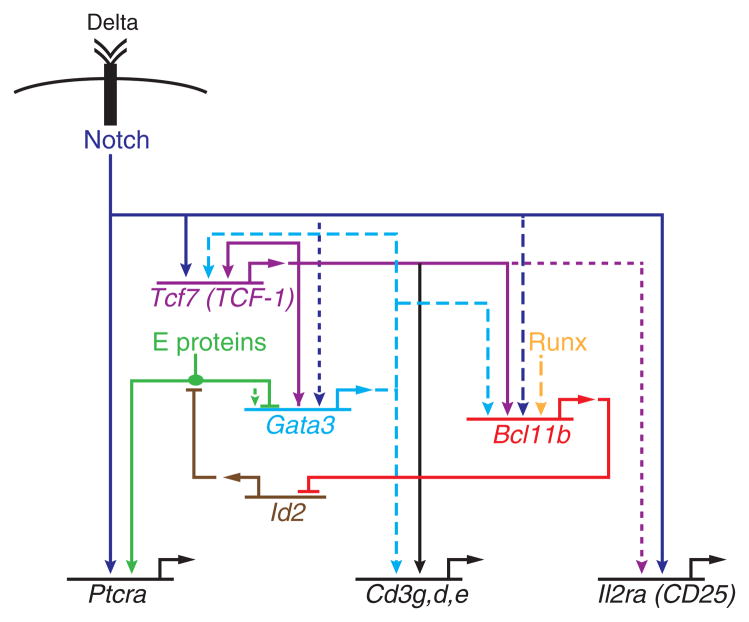
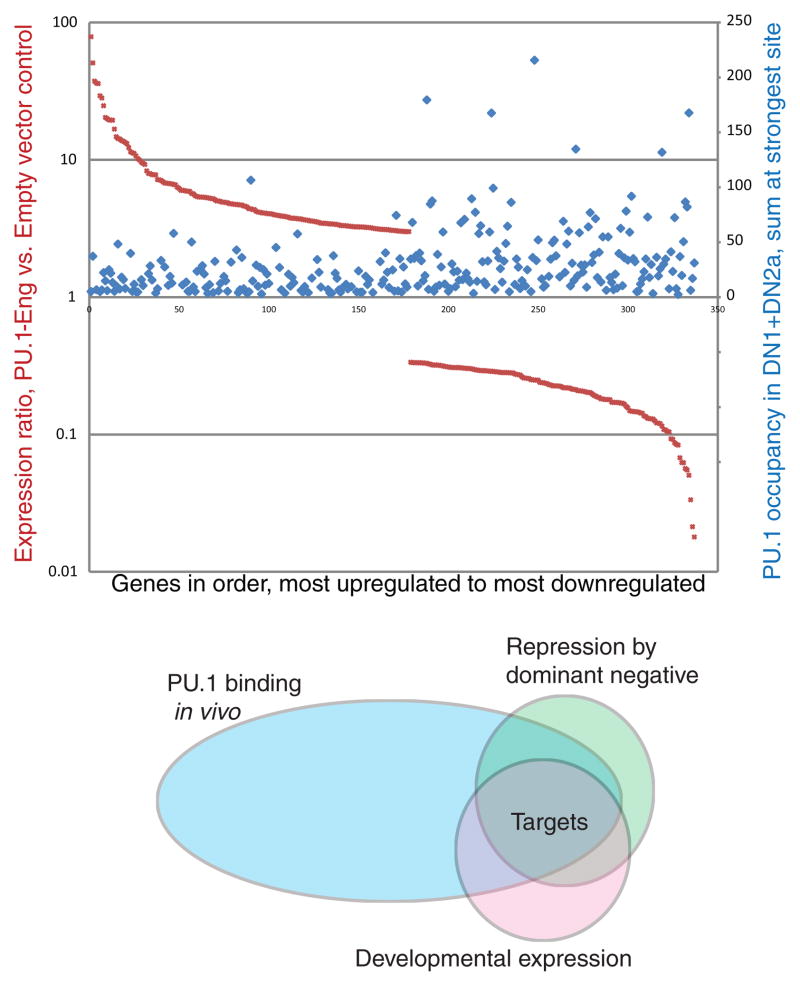
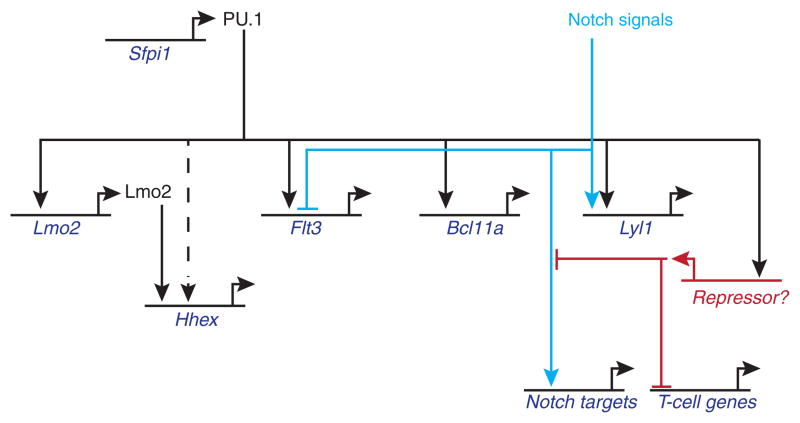
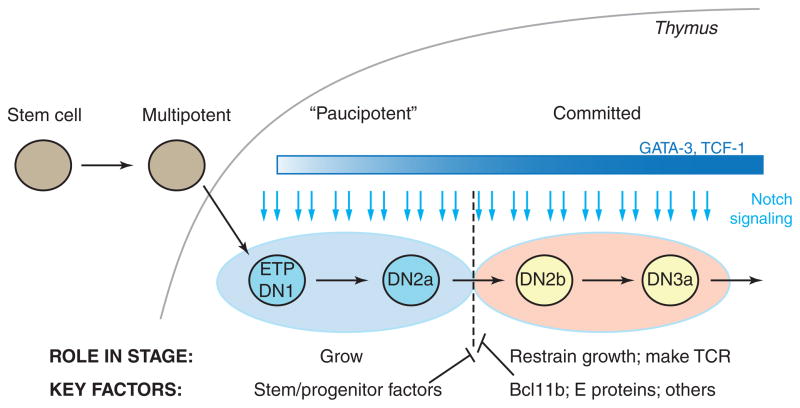
Precursor cell entry into the T-cell developmental pathway can be divided into two phases by the closure of T-lineage commitment. As cells decide against the last alternative options to the T-cell fate, they turn on the transcription factor Bcl11b and silence expression of a group of multipotent progenitor regulatory factors that include hematopoietic transcription factor PU.1. Functional perturbation tests show that Bcl11b is needed for commitment while PU.1 actively participates in keeping open access to alternative fates, until it is silenced; however, PU.1 and Bcl11b both contribute positively to T-cell development. Our recent work reviewed here sheds light on the transcriptional regulatory network that determines the timing and irreversibility of Bcl11b activation, the ways that Notch signaling from the thymic microenvironment restricts the action of PU.1 to prevent it from diverting cells to non-T fates, and the target genes that PU.1 still regulates under the influence of Notch signaling to contribute to T-cell generation. We argue that T-cell development depends on the sequential operation of two interlaced, but mutually antagonistic, gene regulatory networks, one initially supporting expansion before commitment and the other imposing a "terminal" differentiation process on committed cells.
Copyright © 2013 Cold Spring Harbor Laboratory Press; all rights reserved.
Figures
Similar articles
-
Architecture of a lymphomyeloid developmental switch controlled by PU.1, Notch and Gata3.Development. 2013 Mar;140(6):1207-19. doi: 10.1242/dev.088559. Development. 2013. PMID: 23444353 Free PMC article.
-
Regulation of early T-lineage gene expression and developmental progression by the progenitor cell transcription factor PU.1.Genes Dev. 2015 Apr 15;29(8):832-48. doi: 10.1101/gad.259879.115. Epub 2015 Apr 6. Genes Dev. 2015. PMID: 25846797 Free PMC article.
-
Mechanisms of Action of Hematopoietic Transcription Factor PU.1 in Initiation of T-Cell Development.Front Immunol. 2019 Feb 20;10:228. doi: 10.3389/fimmu.2019.00228. eCollection 2019. Front Immunol. 2019. PMID: 30842770 Free PMC article. Review.
-
Bcl11b and combinatorial resolution of cell fate in the T-cell gene regulatory network.Proc Natl Acad Sci U S A. 2017 Jun 6;114(23):5800-5807. doi: 10.1073/pnas.1610617114. Proc Natl Acad Sci U S A. 2017. PMID: 28584128 Free PMC article.
-
Transcriptional network dynamics in early T cell development.J Exp Med. 2024 Oct 7;221(10):e20230893. doi: 10.1084/jem.20230893. Epub 2024 Aug 21. J Exp Med. 2024. PMID: 39167073 Free PMC article. Review.
Cited by
-
Insights into Thymus Development and Viral Thymic Infections.Viruses. 2019 Sep 9;11(9):836. doi: 10.3390/v11090836. Viruses. 2019. PMID: 31505755 Free PMC article. Review.
-
A regulatory network of microRNAs confers lineage commitment during early developmental trajectories of B and T lymphocytes.Proc Natl Acad Sci U S A. 2021 Nov 16;118(46):e2104297118. doi: 10.1073/pnas.2104297118. Proc Natl Acad Sci U S A. 2021. PMID: 34750254 Free PMC article.
-
Core-binding factor leukemia hijacks the T-cell-prone PU.1 antisense promoter.Blood. 2021 Oct 14;138(15):1345-1358. doi: 10.1182/blood.2020008971. Blood. 2021. PMID: 34010414 Free PMC article.
-
Single-Cell Genomics for Virology.Viruses. 2016 May 4;8(5):123. doi: 10.3390/v8050123. Viruses. 2016. PMID: 27153082 Free PMC article. Review.
-
Lunatic, Manic, and Radical Fringe Each Promote T and B Cell Development.J Immunol. 2016 Jan 1;196(1):232-43. doi: 10.4049/jimmunol.1402421. Epub 2015 Nov 25. J Immunol. 2016. PMID: 26608918 Free PMC article.
References
-
- Anderson MK, Weiss AH, Hernandez-Hoyos G, Dionne CJ, Rothenberg EV. Constitutive expression of PU.1 in fetal hematopoietic progenitors blocks T cell development at the pro-T cell stage. Immunity. 2002;16:285–296. - PubMed
-
- Balciunaite G, Ceredig R, Rolink AG. The earliest subpopulation of mouse thymocytes contains potent T, significant macrophage, and natural killer cell but no B-lymphocyte potential. Blood. 2005;105:1930–1936. - PubMed
-
- Bell JJ, Bhandoola A. The earliest thymic progenitors for T cells possess myeloid lineage potential. Nature. 2008;452:764–767. - PubMed
-
- Carotta S, Dakic A, D’Amico A, Pang SH, Greig KT, Nutt SL, Wu L. The transcription factor PU.1 controls dendritic cell development and Flt3 cytokine receptor expression in a dose-dependent manner. Immunity. 2010a;32:628–641. - PubMed
Publication types
MeSH terms
Substances
Grants and funding
LinkOut - more resources
Full Text Sources
Other Literature Sources
Research Materials