. 2013 Oct 24;155(3):688-98.
doi: 10.1016/j.cell.2013.09.049. Epub 2013 Oct 10.

Cyclic dinucleotides trigger ULK1 (ATG1) phosphorylation of STING to prevent sustained innate immune signaling

Affiliations

Cyclic dinucleotides trigger ULK1 (ATG1) phosphorylation of STING to prevent sustained innate immune signaling

Hiroyasu Konno et al. Cell. .

Abstract

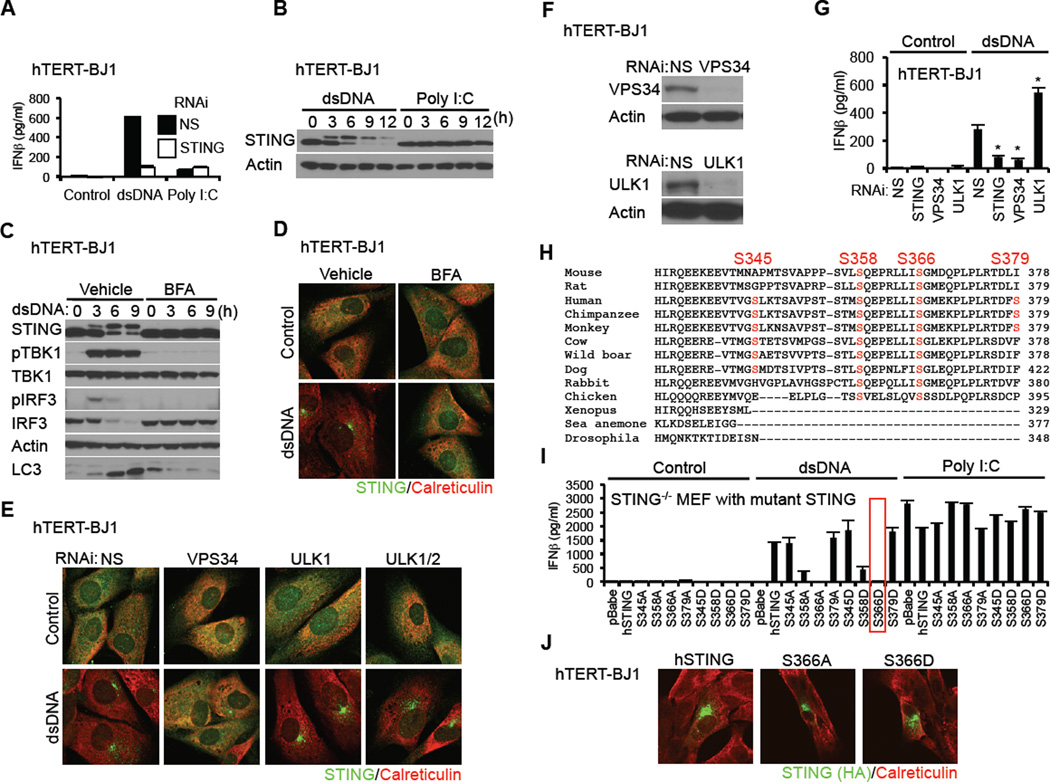
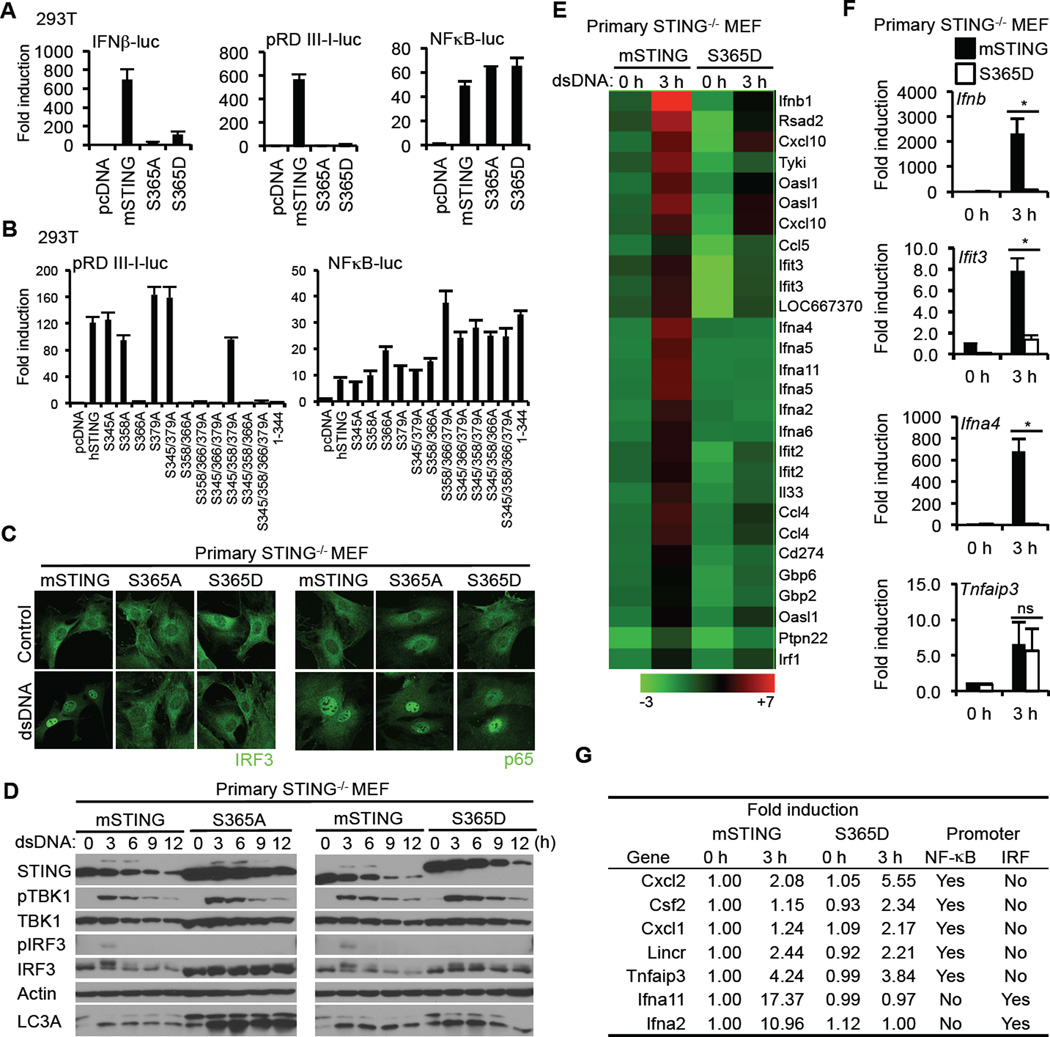
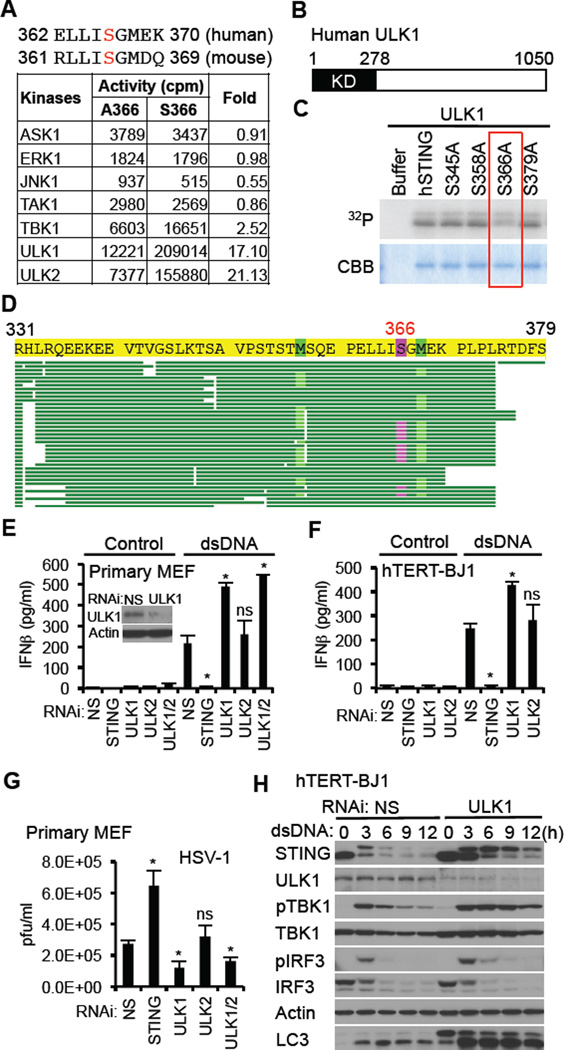
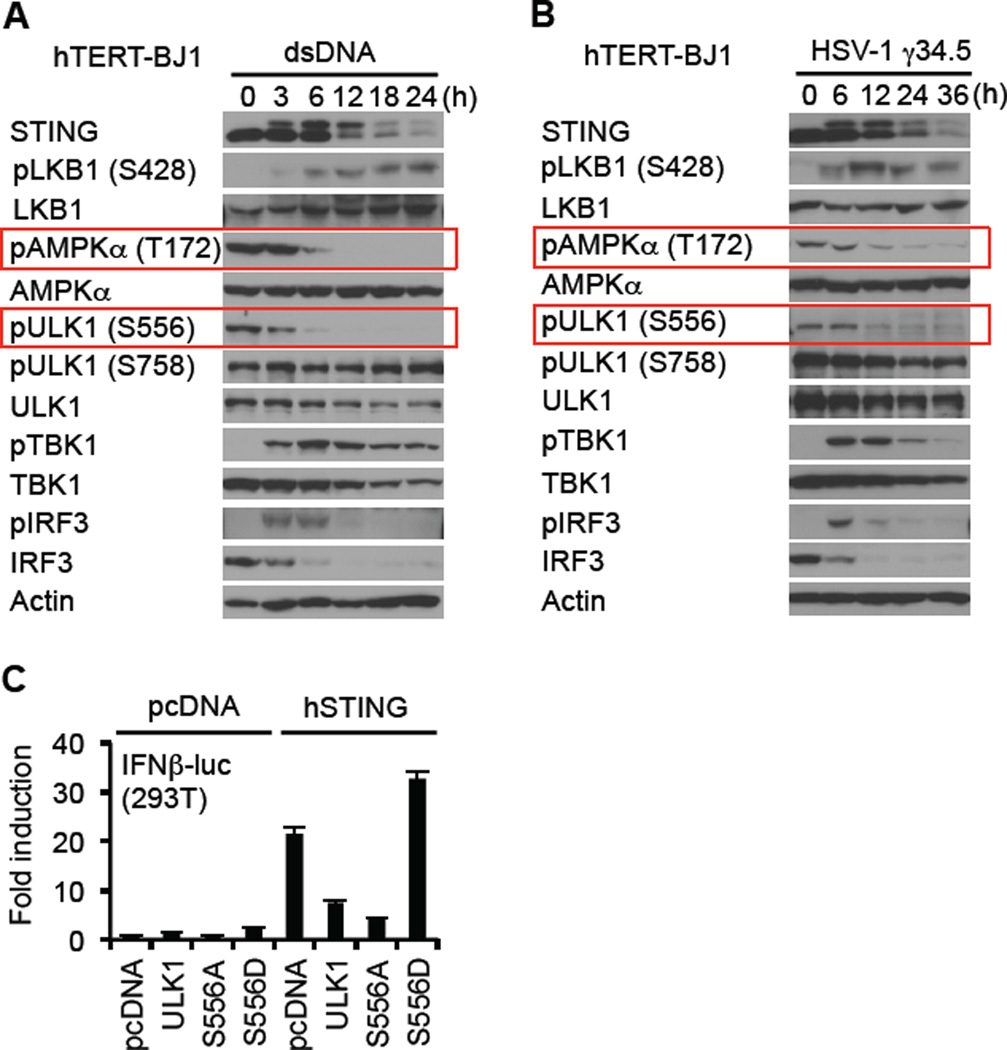
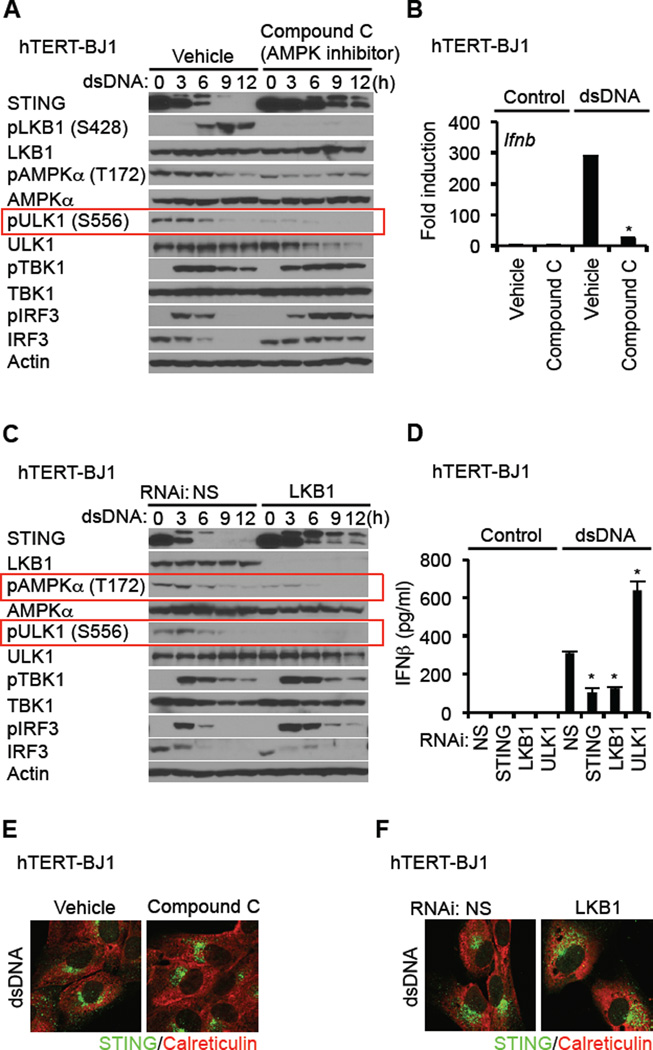
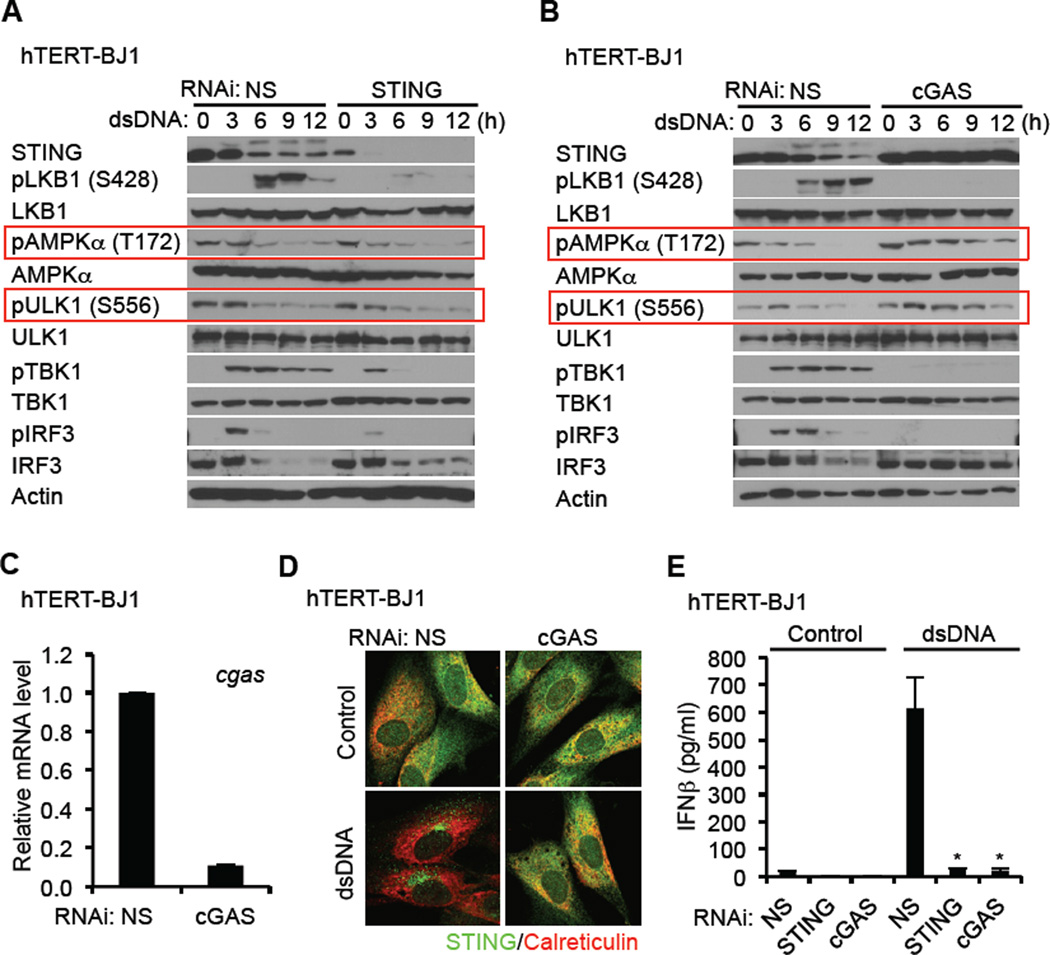
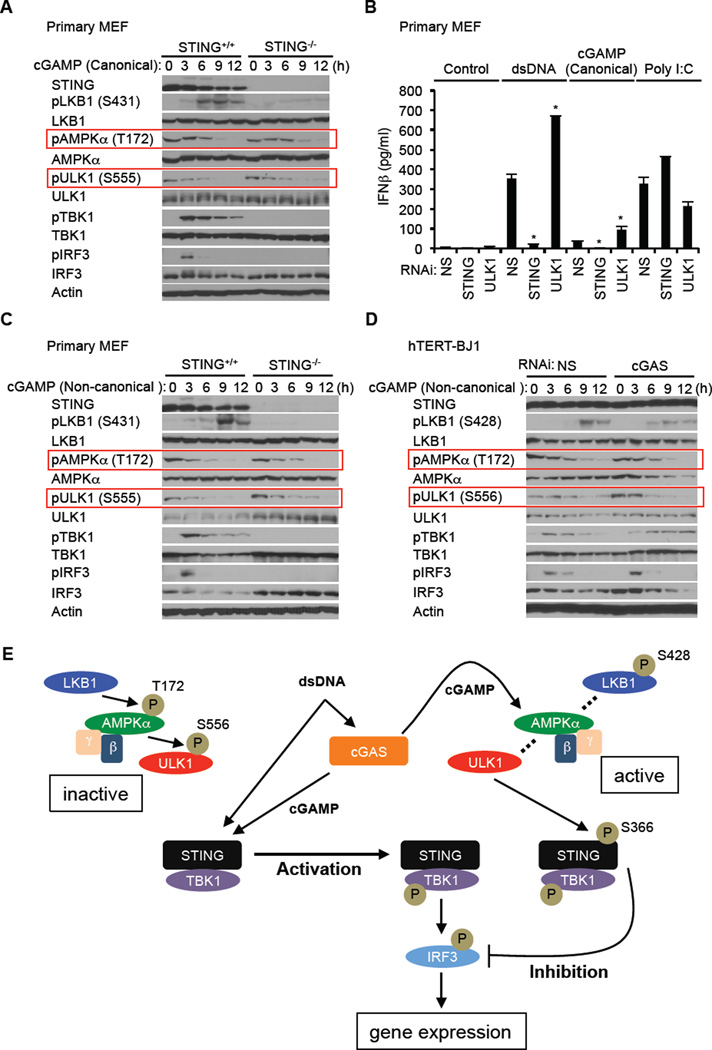
Activation of the stimulator of interferon genes (STING) pathway by microbial or self-DNA, as well as cyclic dinucleotides (CDNs), results in the induction of numerous genes that suppress pathogen replication and facilitate adaptive immunity. However, sustained gene transcription is rigidly prevented to avoid lethal STING-dependent proinflammatory disease by mechanisms that remain unknown. We demonstrate here that, after autophagy-dependent STING delivery of TANK-binding kinase 1 (TBK1) to endosomal/lysosomal compartments and activation of transcription factors interferon regulatory factor 3 (IRF3) and NF-κB, STING is subsequently phosphorylated by serine/threonine UNC-51-like kinase (ULK1/ATG1), and IRF3 function is suppressed. ULK1 activation occurred following disassociation from its repressor AMP activated protein kinase (AMPK) and was elicited by CDNs generated by the cGAMP synthase, cGAS. Thus, although CDNs may initially facilitate STING function, they subsequently trigger negative-feedback control of STING activity, thus preventing the persistent transcription of innate immune genes.


Figures

Figure 1
Figure 1. Phosphorylation of STING S366 Inhibits Type I IFN Production in dsDNA Signaling
(A) hTERT-BJ1 cells were transfected with dsDNA (4 µg/ml) or poly I:C (4 µg/ml) using lipofectamine 2000 for 16 hr. IFNβ level was measured by ELISA. (B) hTERT-BJ1 cells were transfected with dsDNA or poly I:C as described in Figure 1A for the indicated times and STING was detected by immunoblot. (C and D) hTERT-BJ1 cells were incubated with ethanol (vehicle) or BFA (0.05 µg/ml) for 1 hr and then transfected with dsDNA (4 µg/ml) for the indicated times (C) or 6 hr (D). Immunoblot (C) or immunostaining (D) was performed with the indicated antibodies; lack of LC3 processing (bottom band) indicated loss of autophagy. (E) hTERT-BJ1 cells were treated with siRNA (NS: Non-specific siRNA) for 3 days and then transfected with dsDNA (4 µg/ml) for 6 hr. Immunostaining was performed with the indicated antibodies. (F) Immunoblot was performed to confirm knockdown efficiency of ULK1 and VPS34. (G) siRNA-treated hTERT-BJ1 cells were transfected with dsDNA (4 µg/ml) for 16 hr and IFNβ was measured by ELISA. (H) Alignment of STING amino acid sequences. Highlighted amino acids indicate dsDNA-dependent phosphorylated serines, as detected by mass spectrometry. (I) Primary STING−/− MEF cells were reconstituted with STING variants using retroviruses. The cells were transfected with dsDNA (4 µg/ml) or poly I:C (4 µg/ml) for 16 hr and IFNβ measured by ELISA. (J) hTERT-BJ1 cells were transfected with HA-tagged mutant hSTING for 36 hr and immuno-stained with the indicated antibodies. Asterisks indicate significant difference (P < 0.05) compared to NS determined by Student’s t-test. Error bars indicate sd. See also Figure S1.
Figure 2
Figure 2. Phosphorylation of S366 of STING Inhibits IRF3 but not NF-κB Activity
(A and B) HEK293T cells were transfected with plasmids encoding the luciferase gene under control of the indicated promoter with STING variants. After 36 hr, luciferase activity was measured. (C) Primary STING−/− MEF cells were reconstituted with mSTING variants using retroviruses. The cells were transfected with dsDNA (4 µg/ml) for 3 hr and then stained with the indicated antibodies. (D) Reconstituted STING−/− MEF cells were transfected with dsDNA (4 µg/ml) for the indicated times and immunoblots performed. (E) Reconstituted STING−/− MEF cells were transfected with dsDNA (4 µg/ml) for 3 hr. RNA was purified and examined for gene expression with Illumina Sentrix BeadChip Array (Mouse WG6 version2). Pseudo colors indicate transcript levels below, equal to, or above the mean (green, black, and red, respectively). The scale represents the intensity of gene expression (log10 scale). The results shown here are representative of three independent experiments. (F) Realtime PCR was carried out with the indicated probes to confirm gene array analysis shown in Figure 2E. Total RNA was extracted from reconstituted STING−/− MEF cells after dsDNA treatment for 3 hr and then cDNA was synthesized. (G) The expression of NF-κB target genes in STING−/− MEF with S365D was comparable with that in STING−/− MEF with mSTING. Promoter sequence of listed genes (−1000 to +200) was obtained through DBTSS (http://dbtss.hgc.jp) and analyzed by TFSEARCH (http://www.cbrc.jp/research/db/TFSEARCH.html) at threshold score 85. The results shown here are the average of three independent experiments. Asterisks indicate significant difference (P < 0.05) determined by Student’s t-test. ns means not significant. Error bars indicate sd. See also Figure S2.
Figure 3
Figure 3. ULK1 Negatively Regulates IFNβ Production by Phosphorylating STING S366
(A) ELLISGMEK which includes Ser366 was used as substrate to identify ULK1 and ULK2. (B) Schematic of human ULK1. KD is kinase domain. (C) In vitro kinase assay was performed with recombinant ULK1 protein using recombinant hSTING protein as substrate. The indicated serine sites that were identified by mass spectrometry were substituted with alanine. (D) Recombinant hSTING protein was incubated with recombinant ULK1 in presence of ATP for 15 min. Phosphorylated STING was analyzed by mass spectrometry. Highlighted amino acid (S366) was identified as the only phosphorylation site. (E and F) Primary MEF cells (E) or hTERT-BJ1 cells (F) were treated with siRNA as indicated (NS: nonspecific siRNA) and then transfected with dsDNA (4 µg/ml) for 16 hr. IFNβ was measured by ELISA. Knockdown efficiency of ULK1 in primary MEF cells was confirmed by immunoblot. (G) siRNA-treated primary MEF cells were infected with HSV-1 (MOI = 0.1) for 24 h and then plaque assay was performed. (H) siRNA-treated hTERT-BJ1 cells were transfected with dsDNA (4 µg/ml) for the indicated times and then immunoblot was performed. Asterisks indicate significant difference (P < 0.05) compared to NS determined by Student’s t-test. ns means not significant. Error bars indicate sd. See also Figure S3.
Figure 4
Figure 4. dsDNA Induces the Dephosphorylation of AMPK T172 and ULK1 S556
(A and B) hTERT-BJ1 cells were transfected with dsDNA (4 µg/ml) (A) or infected with HSV-1 γ34.5 (MOI = 10) (B) for the indicated times and then immunoblot carried out with the indicated antibodies. (C) HEK293T cells were co-transfected with plasmids encoding luciferase driven by the IFNβ promoter as well as hSTING, and ULK1 variants. After 36 hr, luciferase activity was measured. See also Figure S4.
Figure 5
Figure 5. LKB1 Phosphorylation of AMPK is Disrupted by Cytosolic dsDNA
(A) hTERT-BJ1 cells were treated with DMSO (vehicle) or compound C (10 µM) for 1 hr prior to dsDNA transfection (4 µg/ml) for the indicated times. Immunoblot was performed with the indicated antibodies. (B) hTERT-BJ1 cells were treated with DMSO or compound C as described in Figure 5A and then transfected with dsDNA (4 µg/ml) for 6 hr. cDNA was synthesized from total RNA and then realtime PCR was performed with a probe for Ifnb. (C) hTERT-BJ1 cells were treated with siRNA for NS (Non-specific siRNA) or LKB1 and then transfected with dsDNA (4 µg/ml) for the indicated times. Immunoblot was performed with the indicated antibodies. (D) siRNA-treated hTERT-BJ1 cells were transfected with dsDNA (4 µg/ml) for 16 hr. IFNβ was measured by ELISA. (E and F) hTERT-BJ1 cells were treated with compound C as described in Figure 5A (E) or siRNA for LKB1 as described in Figure 5C (F). Confocal analysis of STING trafficking in response to dsDNA (4 µg/ml) was carried out using anti-STING antibody. Asterisks indicate significant difference (P < 0.05) compared to vehicle (B) or NS (D) determined by Student’s t-test. Error bars indicate sd. See also Figure S5.
Figure 6
Figure 6. cGAS is Required for the Negative Regulation of STING through the AMPK-ULK1 Axis
(A and B) hTERT-BJ1 cells were treated with siRNA for NS (Non-specific), STING (A), and cGAS (B) for three days and then transfected with dsDNA (4 µg/ml) for the indicated times. Immunoblot was performed with the indicated antibodies. (C) Knock down efficiency of cGAS in hTERT-BJ1 cells were confirmed by realtime PCR. (D) siRNA-treated hTERT-BJ1 cells were transfected with dsDNA for 6 hr as described in Figure 6A. STING trafficking was observed by confocal microscopy. (E) siRNA-treated hTERT-BJ1 cells were transfected with dsDNA (4 µg/ml) for 16 hr. IFNβ was measured by ELISA. Asterisks indicate significant difference (P < 0.05) compared to NS determined by Student’s t-test. Error bars indicate sd. See also Figure S6.
Figure 7
Figure 7. cGAMPs Activate AMPK-ULK1 Control of STING
(A) Primary STING+/+ and STING−/− MEF cells were transfected with canonical cGAMP (3’–5’ cGAMP) (8 µg/ml) using lipofectamine 2000 for the indicated times. Immunoblot was performed with the indicated antibodies. (B) Primary MEF cells were treated with siRNA for NS (Non-specific), STING, or ULK1 for three days and then transfected with dsDNA (4 µg/ml), canonical cGAMP (8 µg/ml) or poly I:C (4 µg/ml) as described in Figure 7A for 16 hr. IFNβ was measured by ELISA. (C) Primary STING+/+ and STING−/− MEF cells were transfected with non-canonical cGAMP (2’–3’ cGAMP) (8 µg/ml) as described in Figure 7A for the indicated times. Western blot was performed with the indicated antibodies. (D) hTERT-BJ1 cells were treated with siRNA for NS or cGAS for three days and then transfected with non-canonical cGAMP (8 µg/ml) as described in Figure 7A for the indicated times. Immunoblot was performed with the indicated antibodies. (E) Model of STING activation by cytosolic DNA and subsequent inhibition by ULK1. Asterisks indicate significant difference (P < 0.05) compared to NS determined by Student’s t-test. Error bars indicate sd. See also Figure S6

Comment in

Similar articles

Cited by

References

    1. Abe T, Harashima A, Xia T, Konno H, Konno K, Morales A, Ahn J, Gutman D, Barber GN. STING recognition of cytoplasmic DNA instigates cellular defense. Mol Cell. 2013;50:5–15. - PMC - PubMed
    1. Ablasser A, Goldeck M, Cavlar T, Deimling T, Witte G, Rohl I, Hopfner KP, Ludwig J, Hornung V. cGAS produces a 2'–5'-linked cyclic dinucleotide second messenger that activates STING. Nature. 2013;498:380–384. - PMC - PubMed
    1. Ahn J, Gutman D, Saijo S, Barber GN. STING manifests self DNA-dependent inflammatory disease. Proc Natl Acad Sci U S A. 2012;109:19386–19391. - PMC - PubMed
    1. Alers S, Loffler AS, Wesselborg S, Stork B. Role of AMPK-mTOR-Ulk1/2 in the regulation of autophagy: cross talk, shortcuts, and feedbacks. Mol Cell Biol. 2012;32:2–11. - PMC - PubMed
    1. Alexander A, Walker CL. The role of LKB1 and AMPK in cellular responses to stress and damage. FEBS Lett. 2011;585:952–957. - PubMed

Publication types

MeSH terms

Substances

Associated data