Treatment of mouse liver slices with cholestatic hepatotoxicants results in down-regulation of Fxr and its target genes
- PMID: 24112857
- PMCID: PMC3852711
- DOI: 10.1186/1755-8794-6-39
Treatment of mouse liver slices with cholestatic hepatotoxicants results in down-regulation of Fxr and its target genes
Abstract
Background: Unexpected cholestasis substantially contributes to drug failure in clinical trials. Current models used for safety assessment in drug development do not accurately predict cholestasis in humans. Therefore, it is of relevance to develop new screening models that allow identifying drugs with cholestatic properties.
Methods: We employed mouse precision cut liver slices (PCLS), which were incubated 24 h with two model cholestatic compounds: cyclosporin A (CsA) and chlorpromazine (CPZ). Subsequently, transcriptome analysis using DNA microarrays and q-PCR were performed to identify relevant biological processes and biomarkers. Additionally, histology was carried out and levels of triglycerides (TG) and bile acids (BA) were measured. To verify the ex vivo mouse data, these were compared with publically available human data relevant for cholestasis.
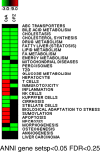
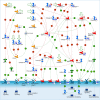
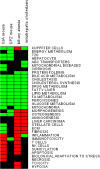
Results: Whole genome gene expression analysis showed that CsA up-regulated pathways related to NF-κB, ER stress and inflammation. Both CsA and CPZ down-regulated processes related to extracellular matrix (ECM) remodelling, BA homeostasis, Fxr signalling, and energy metabolism. The differential expression of a number of characteristic genes (e.g. Abcg5, Abcg8, Klf15, and Baat) could be confirmed by q-PCR. Histology revealed that CsA but not CPZ induced "ballooning" of hepatocytes. No effects on TG and BA levels were observed after incubation of PCLS with CsA and CPZ. A substantial number of processes altered in CsA- and CPZ-treated mouse PCLS ex vivo was also found to be affected in liver biopsies of cholestatic patients.
Conclusion: The present study demonstrated that mouse PCLS can be used as a tool to identify mechanisms of action of cholestatic model compounds. The induction of general stress responses and down-regulated Fxr signalling could play a role in the development of drug induced cholestasis. Importantly, comparative data analysis showed that the ex vivo mouse findings are also relevant for human pathology. Moreover, this work provides a set of genes that are potentially useful to assess drugs for cholestatic properties.
Figures


Similar articles
-
Cyclosporin A induced toxicity in mouse liver slices is only slightly aggravated by Fxr-deficiency and co-occurs with upregulation of pro-inflammatory genes and downregulation of genes involved in mitochondrial functions.BMC Genomics. 2015 Oct 20;16:822. doi: 10.1186/s12864-015-2054-7. BMC Genomics. 2015. PMID: 26482353 Free PMC article.
-
Validation of precision-cut liver slices to study drug-induced cholestasis: a transcriptomics approach.Arch Toxicol. 2017 Mar;91(3):1401-1412. doi: 10.1007/s00204-016-1778-8. Epub 2016 Jun 25. Arch Toxicol. 2017. PMID: 27344345 Free PMC article.
-
Classification of Cholestatic and Necrotic Hepatotoxicants Using Transcriptomics on Human Precision-Cut Liver Slices.Chem Res Toxicol. 2016 Mar 21;29(3):342-51. doi: 10.1021/acs.chemrestox.5b00491. Epub 2016 Mar 9. Chem Res Toxicol. 2016. PMID: 26881866
-
Targeting FXR in Cholestasis.Handb Exp Pharmacol. 2019;256:299-324. doi: 10.1007/164_2019_231. Handb Exp Pharmacol. 2019. PMID: 31201556 Review.
-
Nuclear receptor FXR, bile acids and liver damage: Introducing the progressive familial intrahepatic cholestasis with FXR mutations.Biochim Biophys Acta Mol Basis Dis. 2018 Apr;1864(4 Pt B):1308-1318. doi: 10.1016/j.bbadis.2017.09.019. Epub 2017 Sep 29. Biochim Biophys Acta Mol Basis Dis. 2018. PMID: 28965883 Review.
Cited by
-
Role of endoplasmic reticulum stress in drug-induced toxicity.Pharmacol Res Perspect. 2016 Feb 4;4(1):e00211. doi: 10.1002/prp2.211. eCollection 2016 Feb. Pharmacol Res Perspect. 2016. PMID: 26977301 Free PMC article. Review.
-
Endoplasmic Reticulum Stress Regulates Hepatic Bile Acid Metabolism in Mice.Cell Mol Gastroenterol Hepatol. 2016 Dec 10;3(2):261-271. doi: 10.1016/j.jcmgh.2016.11.006. eCollection 2017 Mar. Cell Mol Gastroenterol Hepatol. 2016. PMID: 28275692 Free PMC article.
-
Mouse precision-cut liver slices as an ex vivo model to study drug-induced cholestasis.Arch Toxicol. 2022 Sep;96(9):2523-2543. doi: 10.1007/s00204-022-03321-2. Epub 2022 Jun 16. Arch Toxicol. 2022. PMID: 35708773 Free PMC article.
-
Omics-based responses induced by bosentan in human hepatoma HepaRG cell cultures.Arch Toxicol. 2018 Jun;92(6):1939-1952. doi: 10.1007/s00204-018-2214-z. Epub 2018 May 14. Arch Toxicol. 2018. PMID: 29761207 Free PMC article.
-
Best Practices and Progress in Precision-Cut Liver Slice Cultures.Int J Mol Sci. 2021 Jul 1;22(13):7137. doi: 10.3390/ijms22137137. Int J Mol Sci. 2021. PMID: 34281187 Free PMC article. Review.
References
-
- Kienhuis AS, Vitins AP, Pennings JL, Pronk TE, Speksnijder EN, Roodbergen M, van Delft JH, Luijten M, van der Ven LT. Cyclosporine A treated in vitro models induce cholestasis response through comparison of phenotype-directed gene expression analysis of in vivo Cyclosporine A-induced cholestasis. Toxicol Lett. 2013;221(3):225–236. doi: 10.1016/j.toxlet.2013.06.236. - DOI - PubMed
Publication types
MeSH terms
Substances
LinkOut - more resources
Full Text Sources
Other Literature Sources
Miscellaneous

