Association between inflammatory infiltrates and isolated monosomy 22/del(22q) in meningiomas
- PMID: 24098347
- PMCID: PMC3788099
- DOI: 10.1371/journal.pone.0074798
Association between inflammatory infiltrates and isolated monosomy 22/del(22q) in meningiomas
Abstract
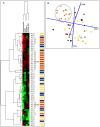
Meningiomas contain highly variable levels of infiltrating tissue macrophages (TiMa) and other immune cells. In this study we investigated the potential association between the number and immunophenotype of inflammatory and other immune cells infiltrating the tumor as evaluated by multiparameter flow cytometry, and the clinico-biological, cytogenetic and gene expression profile (GEP) of 75 meningioma patients. Overall, our results showed a close association between the amount and cellular composition of the inflammatory and other immune cell infiltrates and the cytogenetic profile of the tumors. Notably, tumors with isolated monosomy 22/del(22q) showed greater numbers of TiMa, NK cells and (recently)-activated CD69(+) lymphocytes versus meningiomas with diploid and complex karyotypes. In addition, in the former cytogenetic subgroup of meningiomas, tumor-infiltrating TiMa also showed a more activated and functionally mature phenotype, as reflected by a greater fraction of CD69(+), CD63(+), CD16(+) and CD33(+) cells. GEP at the mRNA level showed a unique GEP among meningiomas with an isolated monosomy 22/del(22q) versus all other cases, which consisted of increased expression of genes involved in inflammatory/immune response, associated with an M1 TiMa phenotype. Altogether, these results suggest that loss of expression of specific genes coded in chromosome 22 (e.g. MIF) is closely associated with an increased homing and potentially also anti-tumoral effect of TiMa, which could contribute to explain the better outcome of this specific good-prognosis cytogenetic subgroup of meningiomas.
Conflict of interest statement
Figures


Similar articles
-
Genetic/molecular alterations of meningiomas and the signaling pathways targeted.Oncotarget. 2015 May 10;6(13):10671-88. doi: 10.18632/oncotarget.3870. Oncotarget. 2015. PMID: 25965831 Free PMC article. Review.
-
Association between mutation of the NF2 gene and monosomy 22 in menopausal women with sporadic meningiomas.BMC Med Genet. 2013 Oct 30;14:114. doi: 10.1186/1471-2350-14-114. BMC Med Genet. 2013. PMID: 24171707 Free PMC article.
-
Combined molecular genetic studies of chromosome 22q and the neurofibromatosis type 2 gene in central nervous system tumors.Neurosurgery. 1995 Oct;37(4):764-73. doi: 10.1227/00006123-199510000-00022. Neurosurgery. 1995. PMID: 8559307
-
Gene expression profiles of meningiomas are associated with tumor cytogenetics and patient outcome.Brain Pathol. 2009 Jul;19(3):409-20. doi: 10.1111/j.1750-3639.2008.00191.x. Epub 2008 Jul 15. Brain Pathol. 2009. PMID: 18637901 Free PMC article.
-
Tumor infiltrating immune cells in gliomas and meningiomas.Brain Behav Immun. 2016 Mar;53:1-15. doi: 10.1016/j.bbi.2015.07.019. Epub 2015 Jul 26. Brain Behav Immun. 2016. PMID: 26216710 Review.
Cited by
-
The Molecular and Immunological Landscape of Meningiomas.Int J Mol Sci. 2024 Sep 5;25(17):9631. doi: 10.3390/ijms25179631. Int J Mol Sci. 2024. PMID: 39273576 Free PMC article. Review.
-
Mismatch repair deficiency in high-grade meningioma: a rare but recurrent event associated with dramatic immune activation and clinical response to PD-1 blockade.JCO Precis Oncol. 2018;2018:PO.18.00190. doi: 10.1200/PO.18.00190. Epub 2018 Nov 27. JCO Precis Oncol. 2018. PMID: 30801050 Free PMC article. No abstract available.
-
A Rapid Robust Method for Subgrouping Non-NF2 Meningiomas According to Genotype and Detection of Lower Levels of M2 Macrophages in AKT1 E17K Mutated Tumours.Int J Mol Sci. 2020 Feb 13;21(4):1273. doi: 10.3390/ijms21041273. Int J Mol Sci. 2020. PMID: 32070062 Free PMC article.
-
Genetic/molecular alterations of meningiomas and the signaling pathways targeted.Oncotarget. 2015 May 10;6(13):10671-88. doi: 10.18632/oncotarget.3870. Oncotarget. 2015. PMID: 25965831 Free PMC article. Review.
-
The clinical, genetic, and immune landscape of meningioma in patients with NF2-schwannomatosis.Neurooncol Adv. 2023 Jun 3;5(Suppl 1):i94-i104. doi: 10.1093/noajnl/vdac127. eCollection 2023 May. Neurooncol Adv. 2023. PMID: 37287576 Free PMC article.
References
-
- Louis DN, Ohgaki H, Wiestler OT, Cavenee WK (2007) Meningeal Tumours. WHO Classification of Tumors of the Central Nervous System. 4 ed. Lyon, France: IARC press. 163–172.
-
- Riemenschneider MJ, Perry A, Reifenberger G (2006) Histological classification and molecular genetics of meningiomas. Lancet Neurol 5: 1045–1054. - PubMed
-
- Espinosa AB, Tabernero MD, Maillo A, Sayagues JM, Ciudad J, et al. (2006) The cytogenetic relationship between primary and recurrent meningiomas points to the need for new treatment strategies in cases at high risk of relapse. Clin Cancer Res 12: 772–780. - PubMed
-
- Kalala JP, Caemaert J, De Ridder L (2004) Primary resected meningiomas: relapses and proliferation markers. In Vivo 18: 411–416. - PubMed
Publication types
MeSH terms
Grants and funding
LinkOut - more resources
Full Text Sources
Other Literature Sources
Miscellaneous

