. 2014 Feb 1;20(3):617-30.
doi: 10.1158/1078-0432.CCR-13-0839. Epub 2013 Oct 4.

Cabozantinib inhibits prostate cancer growth and prevents tumor-induced bone lesions

Affiliations

Cabozantinib inhibits prostate cancer growth and prevents tumor-induced bone lesions

Jinlu Dai et al. Clin Cancer Res. .

Abstract

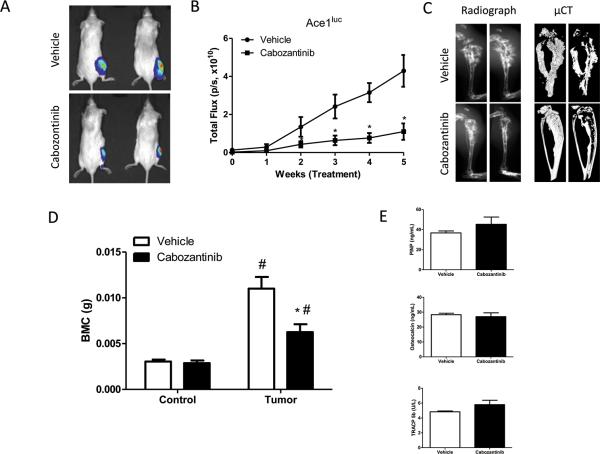
Purpose: Cabozantinib, an orally available multityrosine kinase inhibitor with activity against mesenchymal epithelial transition factor (MET) and VEGF receptor 2 (VEGFR2), induces resolution of bone scan lesions in men with castration-resistant prostate cancer bone metastases. The purpose of this study was to determine whether cabozantinib elicited a direct antitumor effect, an indirect effect through modulating bone, or both.

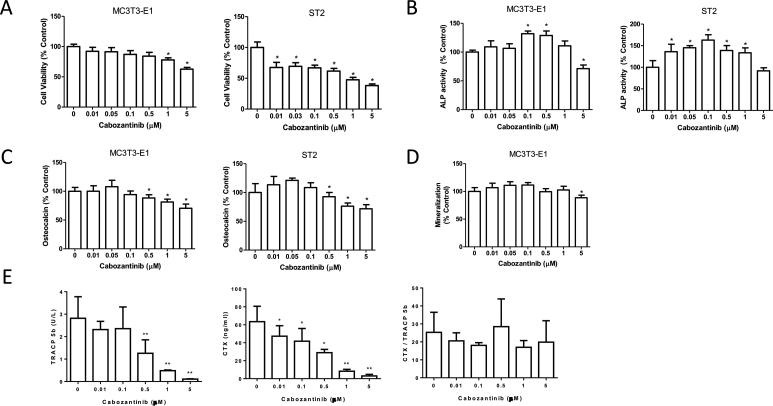
Experimental design: Using human prostate cancer xenograft studies in mice, we determined the impact of cabozantinib on tumor growth in soft tissue and bone. In vitro studies with cabozantinib were performed using (i) prostate cancer cell lines to evaluate its impact on cell growth, invasive ability, and MET and (ii) osteoblast cell lines to evaluate its impact on viability and differentiation and VEGFR2.

Results: Cabozantinib inhibited progression of multiple prostate cancer cell lines (Ace-1, C4-2B, and LuCaP 35) in bone metastatic and soft tissue murine models of prostate cancer, except for PC-3 prostate cancer cells in which it inhibited only subcutaneous growth. Cabozantinib directly inhibited prostate cancer cell viability and induced apoptosis in vitro and in vivo and inhibited cell invasion in vitro. Cabozantinib had a dose-dependent biphasic effect on osteoblast activity and inhibitory effect on osteoclast production in vitro that was reflected in vivo. It blocked MET and VEGFR2 phosphorylation in prostate cancer cells and osteoblast-like cells, respectively.

Conclusion: These data indicate that cabozantinib has direct antitumor activity, and that its ability to modulate osteoblast activity may contribute to its antitumor efficacy.


Figures

Figure 1
Figure 1. Cabozantinib inhibits the progression of Ace-1luc PCa cells in bone in vivo
SCID mice were injected intratibially with Ace-1luc cells (1× 10⁵ in 20μL DMEM/F12) and allowed to become established over a period of 14 days. After establishment of tumor growth in bone, treatment with either cabozantinib (60mg/kg/once daily, per os) (n = 12) or distilled water vehicle (n = 12) was initiated and continued for 5 weeks. Mice were subjected to weekly bioluminescent imaging (BLI). At 5 weeks after initiation of cabozantinib, mice were euthanized, bones subjected to Faxitron X-ray analysis, microCT and dual-energy x-ray absorptiometry (DEXA), and blood was collected and separated into serum that was subjected to enzyme-linked immunoassay for bone markers (PINP, osteocalcin and TRAP 5b). A, Representative BLI imaging. Note the decreased signals in the tibiae of the cabozantinib-treated mice compared with vehicle-treated mice. B, Tumor burden as measured using BLI. Results are reported as relative light units (RLU). *P<0.05 versus vehicle-treated mice. C, Representative radiographic and microCT imaging. Note the decreased osteoblastic activity in the tibiae of the cabozantinib-treated mice compared with vehicle-treated mice. D, Bone mineral content (BMC) measured using DEXA. #P < 0.05 versus no tumor mice for each respective treatment group. *P<0.05 versus tumor-bearing vehicle-treated animals. E, serum PINP, osteocalcin and TRACP 5b levels.
Figure 2
Figure 2. Cabozantinib inhibits progression of PC-3luc and LuCaP-35 PCa cells in soft tissue in vivo
(A-C): PC-3luc cells: SCID mice were injected subcutaneously with PC-3luc cells (1× 10⁶ in 100 μL RPMI 1640) and allowed to grow for 35 days to become established. After establishment of tumor, treatment with either cabozantinib (60mg/kg/daily, per os) (n = 12) or distilled water vehicle (n = 12) was initiated and continued for 15 days. Mice were subjected to bioluminescent imaging (BLI) weekly. At 15 days post-initiation of cabozantinib, mice were euthanized, subcutaneous tumors were collected, weighed and saved in formalin for additional studies. A .Representative BLI of PC-3luc tumors. Note the decreased signals in the tumors of the cabozantinib-treated mice compared with vehicle-treated mouse. B, Tumor burden of PC-3luc tumors as measured using BLI. Results are reported as relative light units (RLU). *P<0.05 versus vehicle-treated mice. C,Tumor weight of PC-3luc tumors. *P<0.05 versus vehicle-treated mice. (D-F): LuCaP-35 cells: LuCaP tumors maintained in SCID mice were made into single cell suspensions. SCID mice were then injected subcutaneously with LuCaP-35 cells (2× 10⁶ in 100 μL RPMI 1640) and allowed to develop into tumors over a period of 42 days. After establishment of tumor, treatment with either cabozantinib (60mg/kg/day, oral administration) (n = 12) or distilled water vehicle (n = 12) was initiated and continued for 10 weeks. The tumors were measured by caliper weekly. At 10 weeks, mice were euthanized; subcutaneous tumors were collected, weighed and saved in formalin for additional studies. D,Tumor volume of LuCaP-35 tumors. *P<0.05 versus control; **P<0.05 versus vehicle plus castration. E, Tumor weight of LuCaP-35 tumors. *P<0.05 versus control; **P<0.05 versus vehicle plus castration. F, PSA levels from mice with LuCaP-35 tumors. *P<0.05 versus control; **P<0.05 versus vehicle plus castration.
Figure 3
Figure 3. Impact of cabozantinib on cellular proliferation and apoptosis of intratibial and soft tissue tumors in mice
Tumors from the mice as described in Figures 1 through 4 were subjected to immunohistochemistry for (A) proliferation (using anti-Ki67) and (C) apoptosis (using anti-activated Caspase 3/7). *B: bone. *N: necrotic tissue. B and D The percent of positively stained cells was measured in three random 40x fields for each section. Results are shown as mean±SD for each section. *P<0.05 versus untreated for each cell line.
Figure 4
Figure 4. Cabozantinib inhibits multiple parameters of PCa tumor progression in PCa cells
A and B. LNCaP, C4-2B and PC-3 PCa cells were plated in 96-well plates (2 × 10³ cells per well) in medium plus 10% FBS and incubated overnight, then media was replaced with 2% FBS-containing media and the indicated concentrations of cabozantinib. After 72 hours, (A) the cell viability was measured using WST-1 assays and (B) apoptosis activity was assayed by measuring caspase 3/7 activity based on cleavage of DEVD substrate using the Apo-ONE kit (Promega). Data are from five replicates and shown as mean±SD. *P<0.05 versus control (0 μM cabozantinib). The experiments were repeated three times. C. LNCaP, C4-2B and PC-3 cells (5 ×10⁴ cells) were added to the inserts of modified-Boyden chambers and treated with the indicated concentrations of cabozantinib (or saline). The plates were incubated for 22 h in a CO2 incubator at 37°C. The chamber inserts were then stained using the Diff-Quick staining kit (Dade-Behring) according to the manufacturer's instructions. The invasion was determined as the percent of cells that migrated through the membrane. Data are from triplicate samples and reported as mean±SD % of control. *P<0.05 versus control. The experiment was repeated three times. D. (1) PSA mRNA expression: LNCaP and C4-2B cells were plated at 5 × 10⁵ cells/ml in 6-well plates and then treated with DHT (1nM) as positive control, DMSO as negative control and the indicated levels of cabozantinib. After 24 hours, total RNA was collected. Total RNA was subjected to PCR for PSA mRNA expression. (2) PSA protein expression: LNCaP and C4-2B cells were plated at 2× 10³ cells/ml in 96-well plates and after 24 hours treated with DHT (1nM) as positive control, DMSO as negative control and the indicated levels of cabozantinib. After 48 hours, the supernatants were collected and PSA level in the supernatants was measured by PSA ELISA and values were normalized to cell numbers as determined by the modified WST-1 assay. Data are from triplicate samples and reported as mean±SD. P<0.05 versus DMSO control.
Figure 5
Figure 5. Cabozantinib impacts pre-osteoblast viability and differentiation
A. MC3T3-E1 and ST2 cells were plated in 96-well plates (2 × 10³ cells per well) in α-MEM medium plus 10% FBS and incubated overnight, then media was replaced with 2% FBS-containing media and the indicated concentrations of cabozantinib. After 72 hours, the cell viability was measured using WST-1 assays. Data are from triplicates and shown as mean±SD. *P<0.05 versus control (0 μM cabozantinib). The experiments were repeated three times. B and C. MC3T3-E1 and ST2 cells were plated in 12-well plates (5 × 10⁴ per well) and grown in α-MEM containing 10% FBS. After the cells were confluent, the medium was replaced with osteoblast differentiating media (α-MEM with 10% FBS, 50 μg/mL ascorbic acid and 10 mmol/L β-glycerophosphate) the indicated concentrations of cabozantinib. Medium was refreshed every 3 days, at days 9, supernatants and cells were collected. (B) Alkaline phosphatase in cell lysates was measured using ALP assay Kit and (C) osteocalcin in media was measured using mouse osteocalcin EIA assay. Data are from triplicates and shown as mean±SD. *P<0.05 versus control (0 μM cabozantinib). The experiments were repeated three times. D. MC3T3-E1 cells were treated as in (B), but allowed to continue growth for 21 days after confluence at which time cells were collected and calcium in cell lysates was measured using a calcium assay that measure the reaction between o-cresolphthalein and calcium. Results were normalized to protein concentration in cells. Data are from three experiments and shown as mean±SD. *P<0.05 versus control (0 μM cabozantinib). (E) For measurement of osteoclast numbers and function RAW cells were plated in 96 well plates with bovine bone chips and RANKL to induce osteoclastogenesis. At day 7, cabozantinib was added to the indicated concentration, and at day 10 supernatant was collected for measurement of TRACP 5b and CTX. The resorption index per osteoclast is calculated as CTX divided by TRACP 5b. Data are from three experiments and shown as mean±SD. *P<0.05 versus control (0 μM cabozantinib).
Figure 6
Figure 6. Cabozantinib inhibits c-MET, VEGFR2 and AKT phosphorylation in PCa cells and pre-osteoblasts
A. PC-3 cells were plated at 2 × 10⁶ cells on100mm plates. After 12 hours, the cells were pre-treated with cabozatinib (1μM) for three hours, then treated with either DMSO (as a negative control) or HGF (50ng/mL, as a positive control) for 20 minutes. Then total protein was extracted from the cells and subjected to immunoblot using anti- MET, anti-phosphorylated-MET (p-MET), anti-Akt, anti-phosphorylated-Akt (p-Akt), and anti- glyceraldehyde-3-phosphate dehydrogenase (GAPDH) primary antibodies and appropriate secondary antibodies. GAPDH was used as an internal control. B and C. ST2 and MC3T3-E1 cells were plated at 2 × 10⁶ cells on 100mm plates. After 12 hours, the cells were pre-treated with cabozantinib (1μM) for three hours, then treated with either DMSO (as a negative control), or VEGF (50ng/mL) for 20 minutes. Protein was then extracted from the cells and subjected to immunoblot analysis using (B) anti-VEGFR2, anti-phosphorylated-VEGFR2 (p-VEGFR2), anti-ERK1/2, anti-phosphorylated-ERK1/2 (p-ERK1/2) or (C) anti-AKT, anti-phosphorylated-AKT (p-AKT), and anti-GAPDH primary antibodies and appropriate secondary antibodies. GAPDH was used as an internal control. These results were obtained from at least three replicate experiments. Gel images were then subjected to densitometry using Image J 1.38x software and densitometry values normalized to GAPDH band values for each lane are reported below each band.

Comment in

Similar articles

Cited by

References

    1. Shah RB, Mehra R, Chinnaiyan AM, Shen R, Ghosh D, Zhou M, et al. Androgen-independent prostate cancer is a heterogeneous group of diseases: lessons from a rapid autopsy program. Cancer Res. 2004;64:9209–16. - PubMed
    1. Dy SM, Asch SM, Naeim A, Sanati H, Walling A, Lorenz KA. Evidence-based standards for cancer pain management. Journal of clinical oncology : official journal of the American Society of Clinical Oncology. 2008;26:3879–85. - PubMed
    1. Mercadante S, Fulfaro F. Management of painful bone metastases. Curr Opin Oncol. 2007;19:308–14. - PubMed
    1. Rajpar S, Fizazi K. Bone targeted therapies in metastatic castration-resistant prostate cancer. Cancer J. 2013;19:66–70. - PubMed
    1. Stella GM, Benvenuti S, Comoglio PM. Targeting the MET oncogene in cancer and metastases. Expert opinion on investigational drugs. 2010;19:1381–94. - PubMed

Publication types