. 2013 Oct 17;5(1):271-82.
doi: 10.1016/j.celrep.2013.09.001. Epub 2013 Oct 3.

CAST-ChIP maps cell-type-specific chromatin states in the Drosophila central nervous system

Affiliations

CAST-ChIP maps cell-type-specific chromatin states in the Drosophila central nervous system

Tamás Schauer et al. Cell Rep. .

Abstract

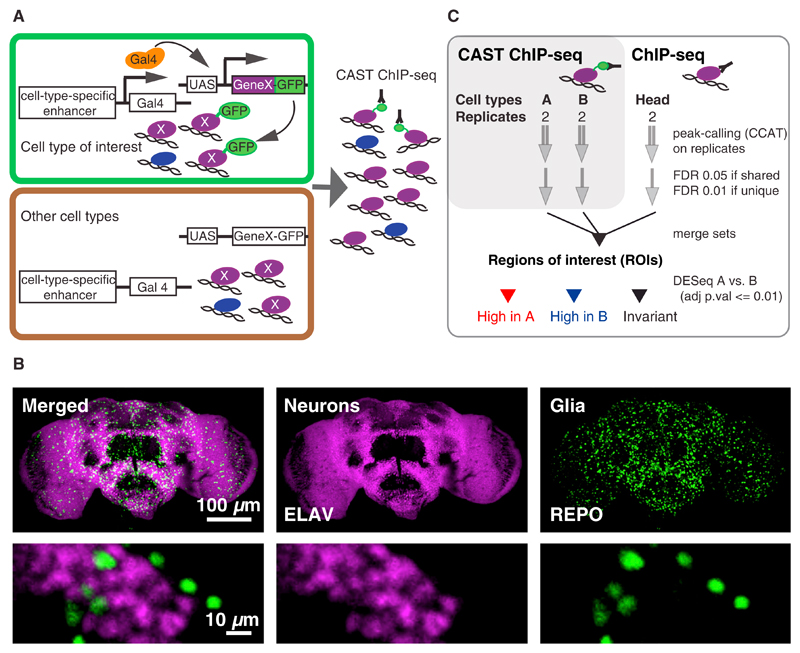
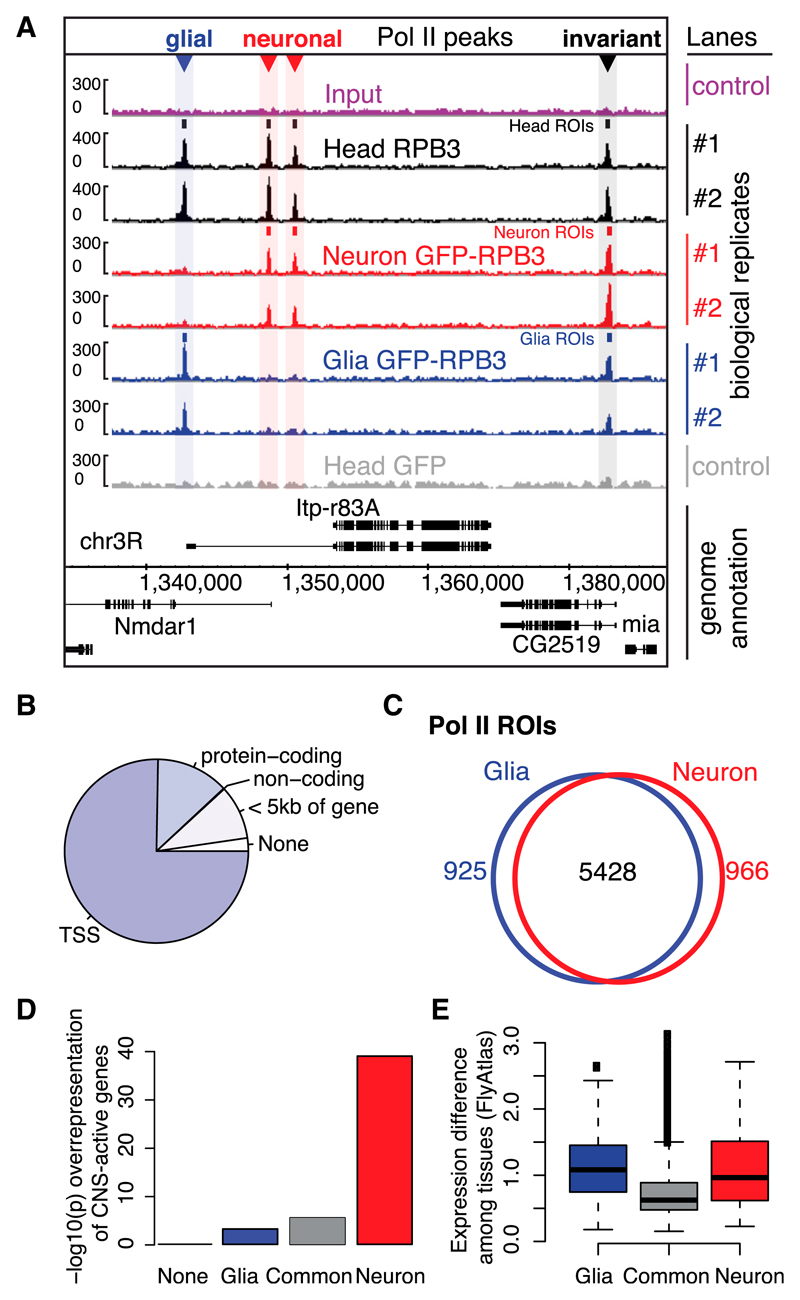
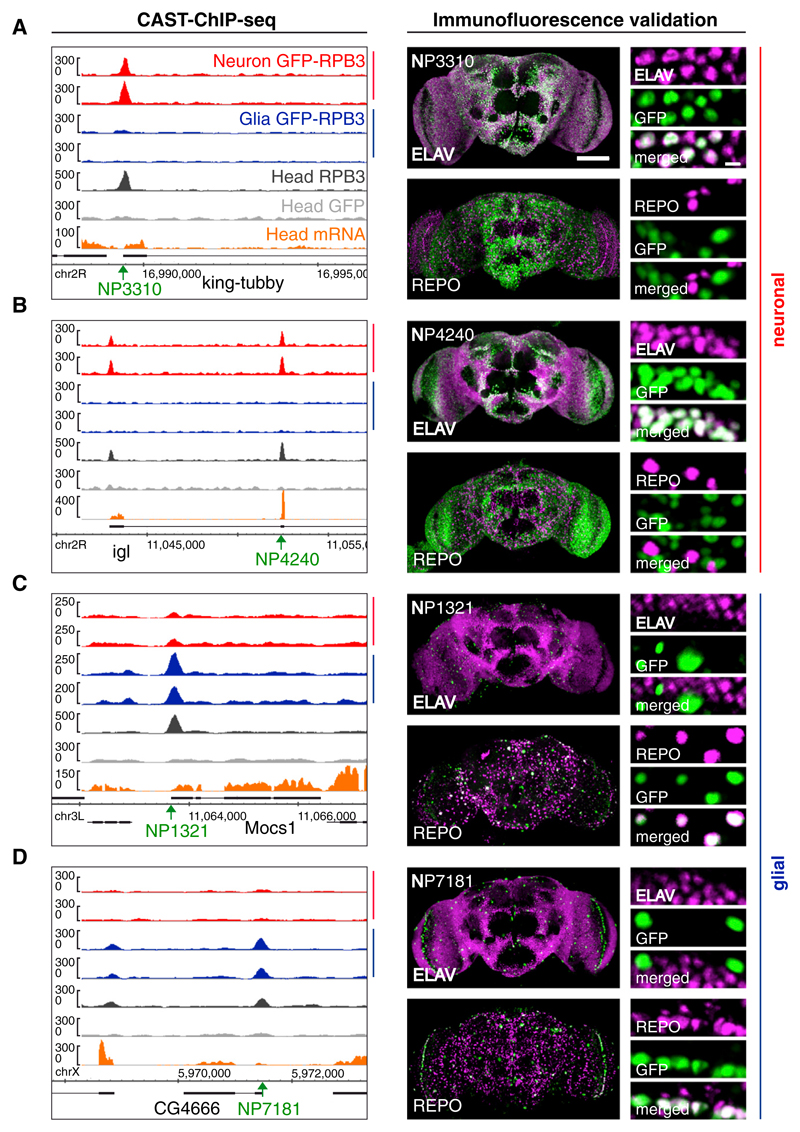
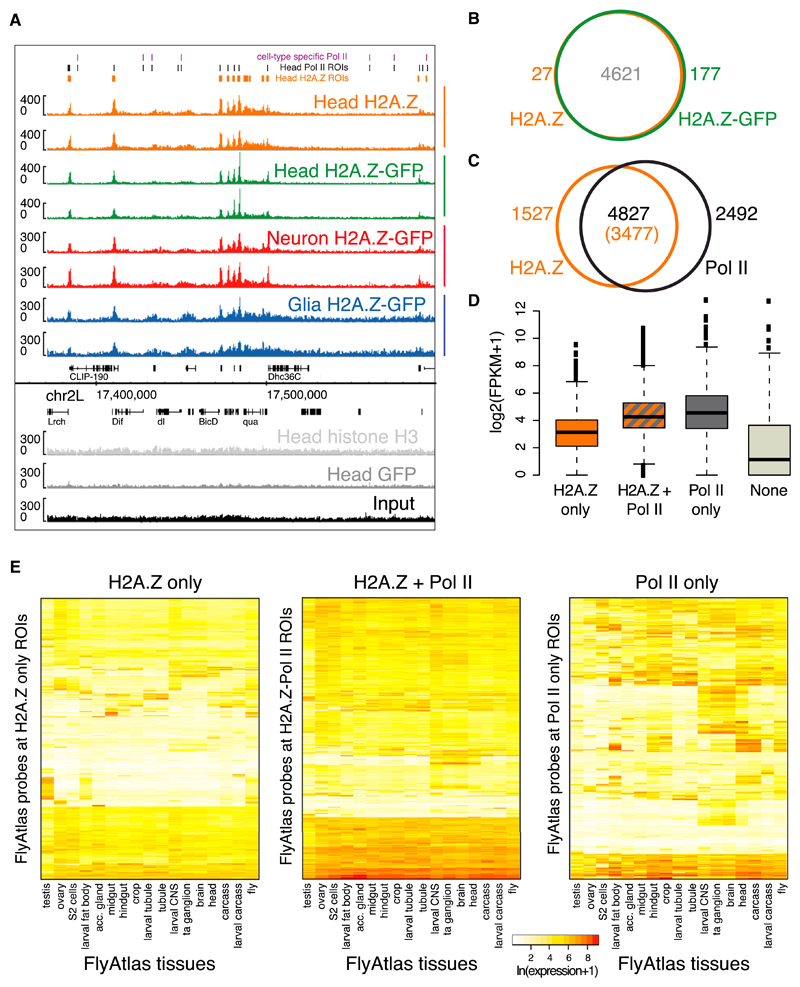
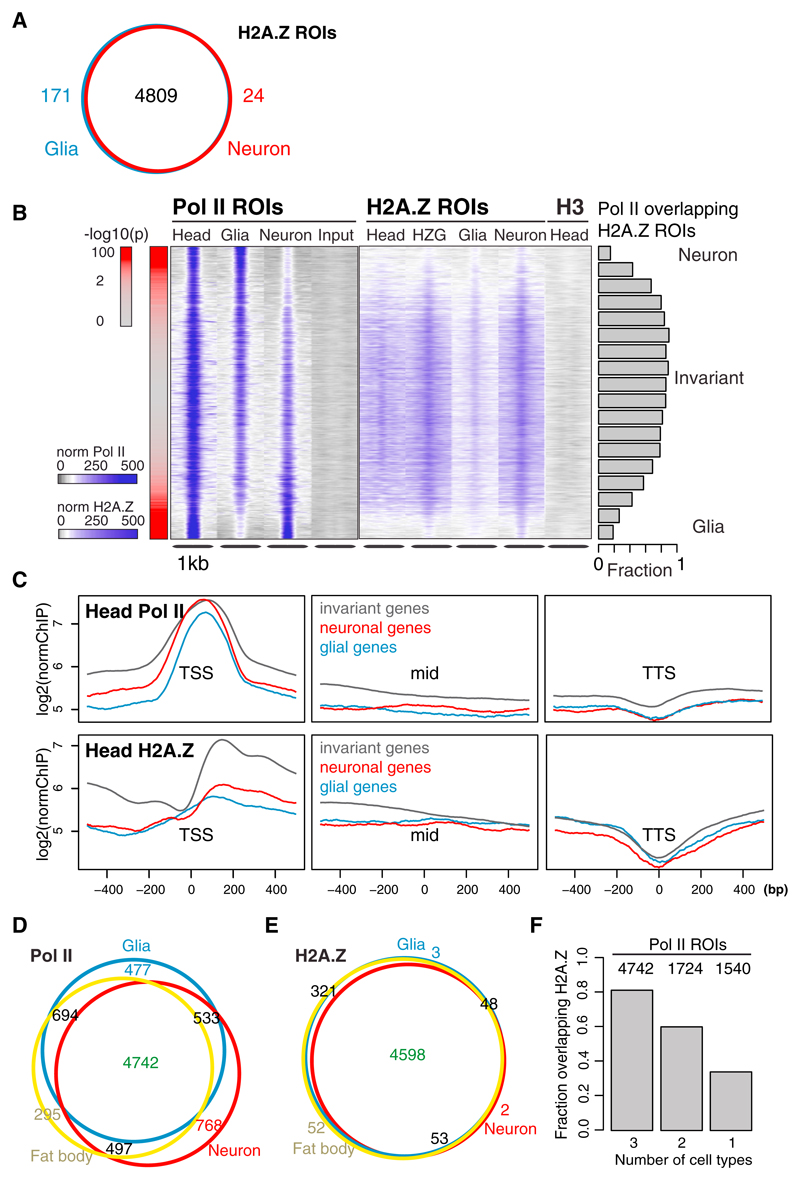
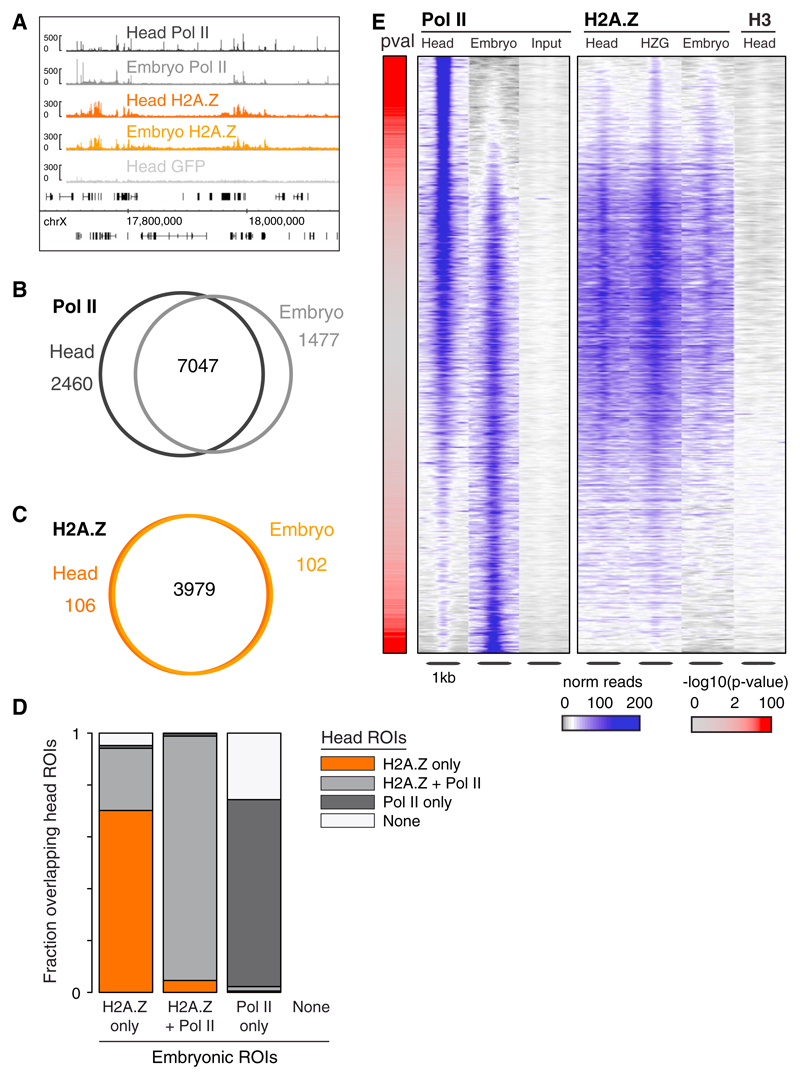
Chromatin organization and gene activity are responsive to developmental and environmental cues. Although many genes are transcribed throughout development and across cell types, much of gene regulation is highly cell-type specific. To readily track chromatin features at the resolution of cell types within complex tissues, we developed and validated chromatin affinity purification from specific cell types by chromatin immunoprecipitation (CAST-ChIP), a broadly applicable biochemical procedure. RNA polymerase II (Pol II) CAST-ChIP identifies ~1,500 neuronal and glia-specific genes in differentiated cells within the adult Drosophila brain. In contrast, the histone H2A.Z is distributed similarly across cell types and throughout development, marking cell-type-invariant Pol II-bound regions. Our study identifies H2A.Z as an active chromatin signature that is refractory to changes across cell fates. Thus, CAST-ChIP powerfully identifies cell-type-specific as well as cell-type-invariant chromatin states, enabling the systematic dissection of chromatin structure and gene regulation within complex tissues such as the brain.


Figures

Figure 1
Figure 1. The CAST-ChIP Methodology
(A) GFP-tagged reporters (GeneX-GFP) are expressed using cell-type-specific drivers. The GFP-tagged protein is then purified from the cell type of interest using a refined ChIP procedure. (B) Fly brain immunohistochemistry of neurons (magenta, anti-ELAV) and glia (green, anti-REPO) indicates two distinct cell types (bottom row, detail). (C) Determination of CAST-ChIP ROIs and regions enriched in specific cell types. See also Figure S2 and Tables S1 and S2.
Figure 2
Figure 2. Distinct RNA Pol II-Enriched Regions in Neurons and Glia
(A) IGB Browser screenshot of the Nmdar1 locus showing CAST-ChIP and ChIP biological replicates of whole-head anti-RPB3 (Head RPB3), neuronal (Neuron) and glial (Glia) GFP-RPB3, whole-head GFP control (Head GFP), and Input. Small rectangles: ROIs; colored triangles: differential ROIs. (B) Pol II ROIs are located mainly at TSSs and in genic regions. (C) Overlap between neuronal and glial Pol II ROIs. (D) Head and neuronal Pol II ROIs are associated with curated CNS-active gene sets (Pfeiffer et al., 2008) (–log10 p values [Fisher’s exact test] are displayed on the y axis). (E) Gene-expression difference (SD of probe-level values) across FlyAtlas tissues (Chintapalli et al., 2007) for genes marked by glial, common, or neuronal Pol II (*p < 10−16, Wilcoxon rank-sum test for glial-versus-common and neuronal-versus-common comparisons). See also Figure S1 and Tables S3 and S4.
Figure 3
Figure 3. Validation of Neuronal and Glial Pol II Enrichment
(A–D) To validate neuron- and glia-specific Pol II ROIs, we assayed the neuronal and glial specificity of enhancer-trap insertion lines driving nuclear GFP at (A) king-tubby, (B) Igl, (C) Mocs1, and (D) CG4666. Left panels: Pol II profiles for neurons and glia, whole-head Pol II ChIP, GFP control, and whole-head mRNA tracks, including gene annotation and location of the Gal4 driver (green arrow, insertion point). Right panels: costaining of nuclear GFP (green) expressed using Gal4 drivers located in proximity to the cell-type-specific Pol II ROIs, alongside REPO or ELAV (magenta) to reveal expression overlaps (white). See also Figure S3.
Figure 4
Figure 4. Enrichment of Histone H2A.Z in Neurons and Glia
(A) Screenshot on chr2L showing biological replicates of whole-head endogenous- and GFP-tagged H2A.Z, neuronal, and glial H2A.Z, as well as whole-head H3, GFP, and Input. (B) Overlap between endogenous and GFP-tagged H2A.Z ROIs in the whole head. (C) Overlap between endogenous H2A.Z and Pol II ROIs in whole heads relative to the total number of Pol II (or H2A.Z) ROIs. (D) Gene-expression levels (log2(FPKM+1)) in whole heads for H2A.Z-only, H2A.Z+Pol II, Pol II-only, and None (neither H2A.Z nor Pol II) gene classes. The p values for all comparisons are p < 2.2 × 10⁻¹⁶, except for H2A.Z+Pol II versus Pol II-only, where p = 0.003 (Wilcoxon rank-sum test). (E) Heatmaps showing gene-expression levels (color range) in FlyAtlas tissues (Chintapalli et al., 2007). Genes that do not overlap H2A.Z ROIs (third panel) show larger differences in expression across tissues. Genes marked by Pol II show higher expression (second and third panels) compared with H2A.Z-only genes (first panel). See also Figure S4.
Figure 5
Figure 5. H2A.Z Marks Cell-Type-Invariant, but Not Active Cell-Type-Specific, Genes
(A) Overlap between neuronal and glial H2A.Z ROIs. (B) Head, glial, and neuronal Pol II and H2A.Z enrichments, as well as GFP-tagged head H2A.Z (HZG), H3, and Input at whole-head Pol II ROIs. Regions are centered on the point with maximal Pol II intensity and sorted from highest to lowest signal in glia (–log10 p values are shown in red on the left). The fractions of H2A.Z ROIs overlapping bins of 25 Pol II ROIs are shown as barplots. The data were only normalized to the total number of reads, and the same scale was used for all Pol II, H2A.Z, and H3 data. (C) Average ChIP enrichment of head Pol II and head H2A.Z centered on the TSS, gene bodies (1 kb around the center of the transcript, labeled “mid”) and transcription termination site (TTS) of genes associated with invariant, neuronal, and glial Pol II CAST-ChIP ROIs. (D) Overlap between neuronal, glial, and fat body Pol II ROIs. (E) Overlap between neuronal, glial, and fat body H2A.Z ROIs. (F) Fraction of Pol II-bound regions found in one (1), two (2), or all three (3) cell types (neuron, glia, and fat body) that overlap at least one whole-head H2A.Z ROI. The total number of Pol II ROIs in each class is indicated on the graph. Pol II-bound regions present in all three cell types (4,725) largely overlap with H2A.Z. See also Figure S5.
Figure 6
Figure 6. H2A.Z Locations Are Conserved from the Embryo to the Adult Brain
(A) IGB Browser screenshot on chromosome X showing adult head and embryo Pol II and H2A.Z, as well as head GFP. (B) Overlap between embryonic and whole-head Pol II-bound genes. (C) Overlap between embryonic and whole-head H2A.Z-bound genes. (D) Fraction of embryonic ROIs (H2A.Z-only, H2A.Z+Pol II, and Pol II-only) overlapping head ROIs (H2A.Z-only, H2A.Z+Pol II, Pol II-only, and None [neither H2A.Z nor Pol II]). Total number of embryonic ROIs: 1,126 in the H2A.Z-only group, 2,828 in the H2A.Z+Pol II group, and 4,489 in the Pol II-only group. (E) Adult head and embryonic Pol II, and H2A.Z enrichment at Pol II-enriched regions. Controls: Input, H3, H2A.Z.-GFP (HZG). Regions are centered and sorted as in Figure 5B. See also Figure S6.
Figure 7
Figure 7. H2A.Z Marks Constitutive Transcriptional Competence
(A) IGB Browser view of low-tissue-specificity genes (Tau clusters) (Weber and Hurst, 2011), gene-based H2A.Z clusters, 0–6 hr embryo and adult head H2A.Z tracks (embryo and head H2A.Z), and five-state chromatin domains (Filion et al., 2010), respectively. H2A.Z overlaps constitutively active (yellow) chromatin regions and Tau clusters. (B) Fractions of H2A.Z-only (HZ-only), H2A.Z and Pol II (HZ+Pol II), and Pol II-only (Pol II-only) ROIs associated with color-coded chromatin domains (Filion et al., 2010). Top-enriched domains are shown with solid colors and transitions are shown with striped colors. Classes are ordered proportionally and the less abundant classes are indicated as “other classes” (gray). (C) Fraction of ROIs (H2A.Z-only [HZ-only], H2A.Z and Pol II [HZ+Pol II], and Pol II-only [Pol II-only]) overlapping insulator-binding proteins. The overlap between H2A.Z+Pol II and CP190, and BEAF-32 and CTCF is highly significant (one-sided Fisher’s exact test; p < 2.2 × 10⁻¹⁶). See also Figure S7.

Similar articles

Cited by

References

    1. Adelman K, Lis JT. Promoter-proximal pausing of RNA polymerase II: emerging roles in metazoans. Nat Rev Genet. 2012;13:720–731. - PMC - PubMed
    1. Adelman K, Wei W, Ardehali MB, Werner J, Zhu B, Reinberg D, Lis JT. Drosophila Paf1 modulates chromatin structure at actively transcribed genes. Mol Cell Biol. 2006;26:250–260. - PMC - PubMed
    1. Anders S, Huber W. Differential expression analysis for sequence count data. Genome Biol. 2010;11:R106. - PMC - PubMed
    1. Barski A, Cuddapah S, Cui K, Roh T-Y, Schones DE, Wang Z, Wei G, Chepelev I, Zhao K. High-resolution profiling of histone methylations in the human genome. Cell. 2007;129:823–837. - PubMed
    1. Bonn S, Zinzen RP, Girardot C, Gustafson EH, Perez-Gonzalez A, Delhomme N, Ghavi-Helm Y, Wilczyński B, Riddell A, Furlong EEM. Tissue-specific analysis of chromatin state identifies temporal signatures of enhancer activity during embryonic development. Nat Genet. 2012;44:148–156. - PubMed

Publication types

MeSH terms

LinkOut - more resources