

Identification of small exonic CNV from whole-exome sequence data and application to autism spectrum disorder
- PMID: 24094742
- PMCID: PMC3791269
- DOI: 10.1016/j.ajhg.2013.09.001
Identification of small exonic CNV from whole-exome sequence data and application to autism spectrum disorder
Abstract
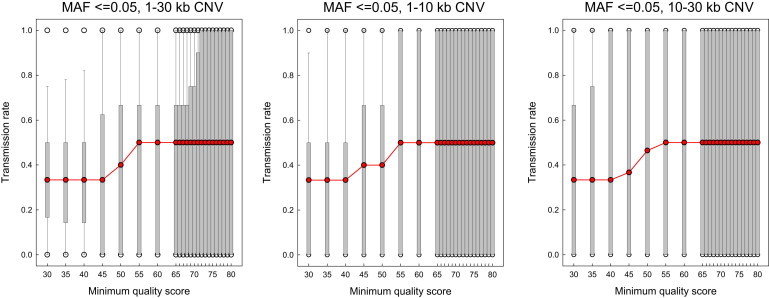
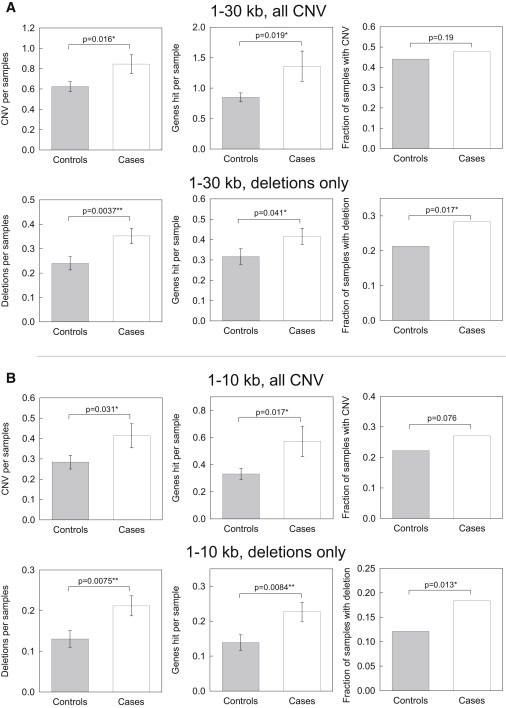
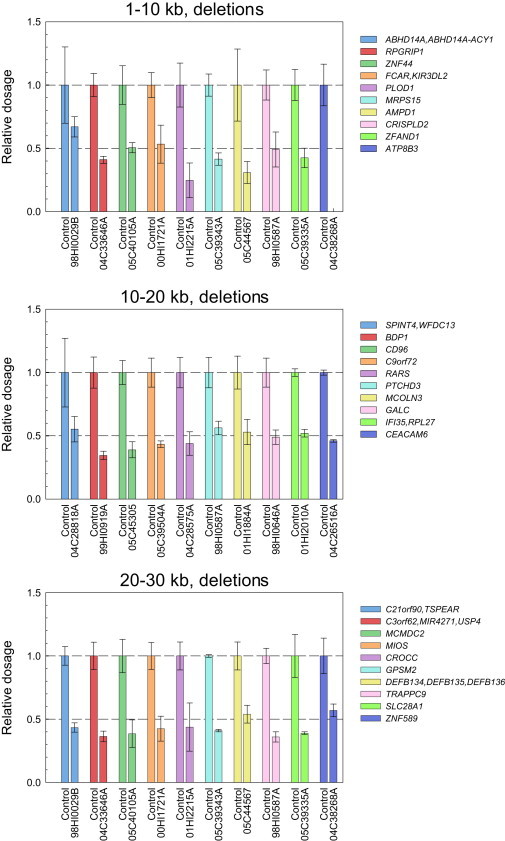
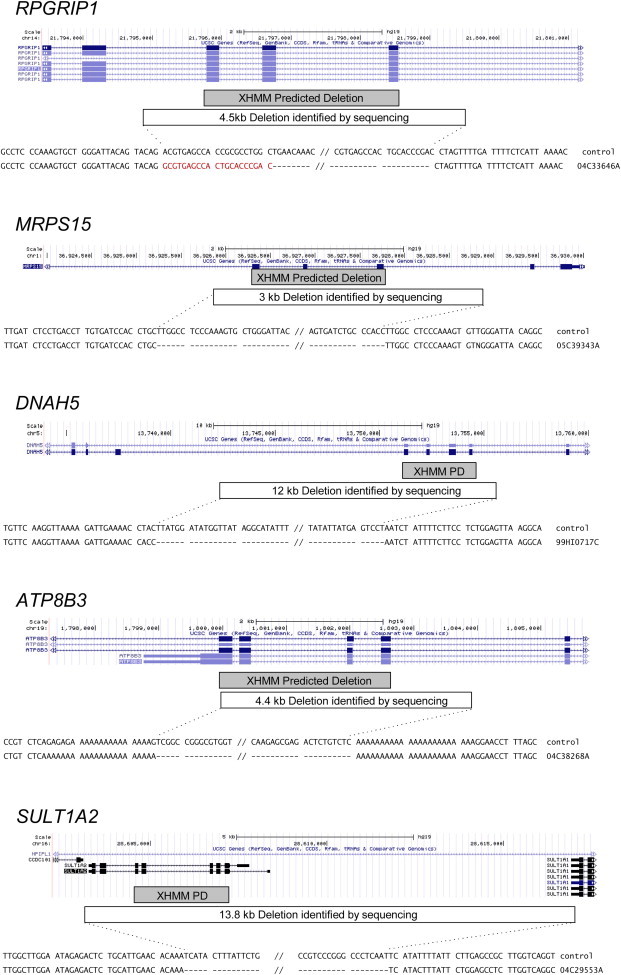
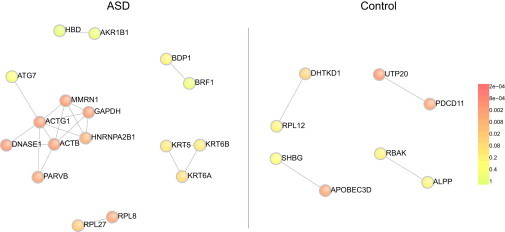
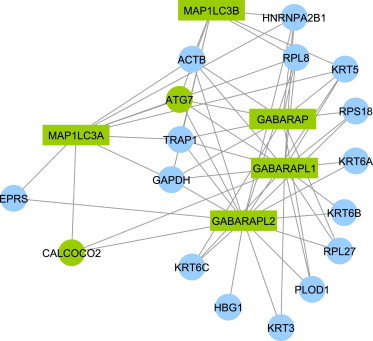
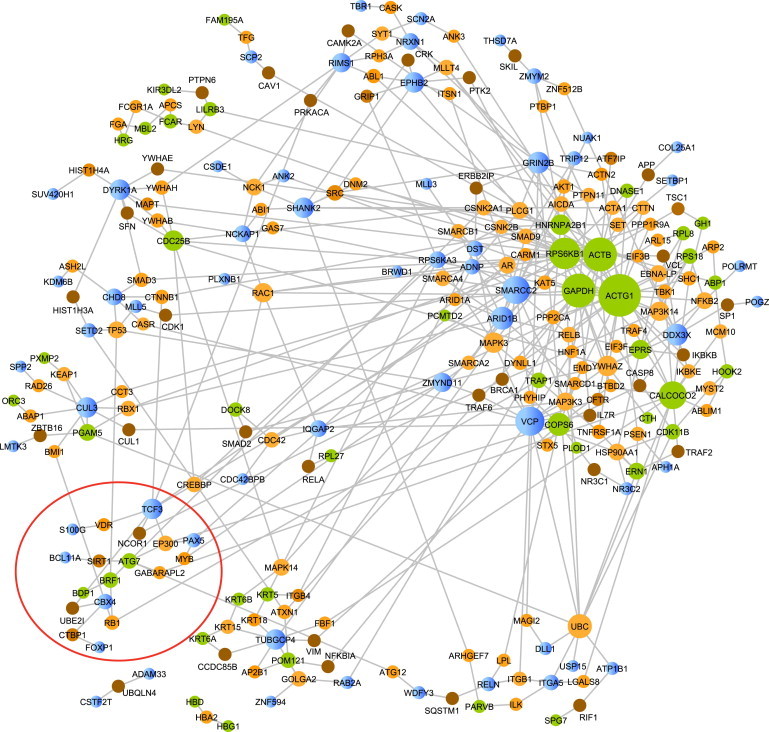
Copy number variation (CNV) is an important determinant of human diversity and plays important roles in susceptibility to disease. Most studies of CNV carried out to date have made use of chromosome microarray and have had a lower size limit for detection of about 30 kilobases (kb). With the emergence of whole-exome sequencing studies, we asked whether such data could be used to reliably call rare exonic CNV in the size range of 1-30 kilobases (kb), making use of the eXome Hidden Markov Model (XHMM) program. By using both transmission information and validation by molecular methods, we confirmed that small CNV encompassing as few as three exons can be reliably called from whole-exome data. We applied this approach to an autism case-control sample (n = 811, mean per-target read depth = 161) and observed a significant increase in the burden of rare (MAF ≤1%) 1-30 kb CNV, 1-30 kb deletions, and 1-10 kb deletions in ASD. CNV in the 1-30 kb range frequently hit just a single gene, and we were therefore able to carry out enrichment and pathway analyses, where we observed enrichment for disruption of genes in cytoskeletal and autophagy pathways in ASD. In summary, our results showed that XHMM provided an effective means to assess small exonic CNV from whole-exome data, indicated that rare 1-30 kb exonic deletions could contribute to risk in up to 7% of individuals with ASD, and implicated a candidate pathway in developmental delay syndromes.
Copyright © 2013 The American Society of Human Genetics. Published by Elsevier Inc. All rights reserved.
Figures
Similar articles
-
Exome sequence read depth methods for identifying copy number changes.Brief Bioinform. 2015 May;16(3):380-92. doi: 10.1093/bib/bbu027. Epub 2014 Aug 28. Brief Bioinform. 2015. PMID: 25169955 Review.
-
Discovery and statistical genotyping of copy-number variation from whole-exome sequencing depth.Am J Hum Genet. 2012 Oct 5;91(4):597-607. doi: 10.1016/j.ajhg.2012.08.005. Am J Hum Genet. 2012. PMID: 23040492 Free PMC article.
-
An integrated analysis of rare CNV and exome variation in Autism Spectrum Disorder using the Infinium PsychArray.Sci Rep. 2020 Feb 21;10(1):3198. doi: 10.1038/s41598-020-59922-3. Sci Rep. 2020. PMID: 32081867 Free PMC article.
-
Copy number variants calling from WES data through eXome hidden Markov model (XHMM) identifies additional 2.5% pathogenic genomic imbalances smaller than 30 kb undetected by array-CGH.Ann Hum Genet. 2022 Jul;86(4):171-180. doi: 10.1111/ahg.12459. Epub 2022 Feb 9. Ann Hum Genet. 2022. PMID: 35141892
-
Copy-number variation in the pathogenesis of autism spectrum disorder.Psychiatry Clin Neurosci. 2014 Feb;68(2):85-95. doi: 10.1111/pcn.12128. Epub 2013 Dec 29. Psychiatry Clin Neurosci. 2014. PMID: 24372918 Review.
Cited by
-
Assessing the reproducibility of exome copy number variations predictions.Genome Med. 2016 Aug 8;8(1):82. doi: 10.1186/s13073-016-0336-6. Genome Med. 2016. PMID: 27503473 Free PMC article.
-
The genetics of microdeletion and microduplication syndromes: an update.Annu Rev Genomics Hum Genet. 2014;15:215-244. doi: 10.1146/annurev-genom-091212-153408. Epub 2014 Apr 16. Annu Rev Genomics Hum Genet. 2014. PMID: 24773319 Free PMC article. Review.
-
The Autism Simplex Collection: an international, expertly phenotyped autism sample for genetic and phenotypic analyses.Mol Autism. 2014 May 20;5:34. doi: 10.1186/2040-2392-5-34. eCollection 2014. Mol Autism. 2014. PMID: 25392729 Free PMC article.
-
Genetic Studies in Autism.Indian J Pediatr. 2016 Oct;83(10):1133-40. doi: 10.1007/s12098-015-1989-7. Epub 2016 Mar 3. Indian J Pediatr. 2016. PMID: 26935198
-
Next-generation sequencing of duplication CNVs reveals that most are tandem and some create fusion genes at breakpoints.Am J Hum Genet. 2015 Feb 5;96(2):208-20. doi: 10.1016/j.ajhg.2014.12.017. Epub 2015 Jan 29. Am J Hum Genet. 2015. PMID: 25640679 Free PMC article.
References
-
- Iafrate A.J., Feuk L., Rivera M.N., Listewnik M.L., Donahoe P.K., Qi Y., Scherer S.W., Lee C. Detection of large-scale variation in the human genome. Nat. Genet. 2004;36:949–951. - PubMed
-
- Sanders S.J., Ercan-Sencicek A.G., Hus V., Luo R., Murtha M.T., Moreno-De-Luca D., Chu S.H., Moreau M.P., Gupta A.R., Thomson S.A. Multiple recurrent de novo CNVs, including duplications of the 7q11.23 Williams syndrome region, are strongly associated with autism. Neuron. 2011;70:863–885. - PMC - PubMed
-
- Sebat J., Lakshmi B., Troge J., Alexander J., Young J., Lundin P., Månér S., Massa H., Walker M., Chi M. Large-scale copy number polymorphism in the human genome. Science. 2004;305:525–528. - PubMed
-
- Jakobsson M., Scholz S.W., Scheet P., Gibbs J.R., VanLiere J.M., Fung H.-C., Szpiech Z.A., Degnan J.H., Wang K., Guerreiro R. Genotype, haplotype and copy-number variation in worldwide human populations. Nature. 2008;451:998–1003. - PubMed
Publication types
MeSH terms
Grants and funding
LinkOut - more resources
Full Text Sources
Other Literature Sources
Miscellaneous
