

Hyperglycemia induces differential change in oxidative stress at gene expression and functional levels in HUVEC and HMVEC
- PMID: 24093550
- PMCID: PMC3851327
- DOI: 10.1186/1475-2840-12-142
Hyperglycemia induces differential change in oxidative stress at gene expression and functional levels in HUVEC and HMVEC
Abstract
Background: Endothelial dysfunction precedes pathogenesis of vascular complications in diabetes. In recent years, the mechanisms of endothelial dysfunction were investigated to outline strategies for its treatment. However, the therapies for dysfunctional endothelium resulted in multiple clinical trial failures and remain elusive. There is a need for defining hyperglycemia-induced endothelial dysfunction with both generic and specific dysfunctional changes in endothelial cells (EC) using a systems approach. In this study, we investigated hyperglycemia-induced endothelial dysfunction in HUVEC and HMVEC. We investigated hyperglycemia-induced functional changes (superoxide (O₂⁻), and hydrogen peroxide (H₂O₂) production and mitochondrial membrane polarization) and gene expression fingerprints of related enzymes (nitric oxide synthase, NAD(P)H oxidase, and reactive oxygen species (ROS) neutralizing enzymes) in both ECs.
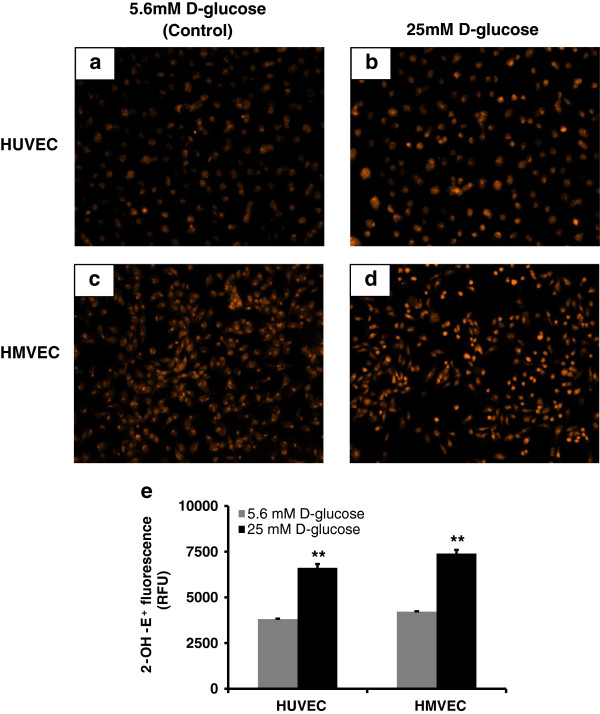
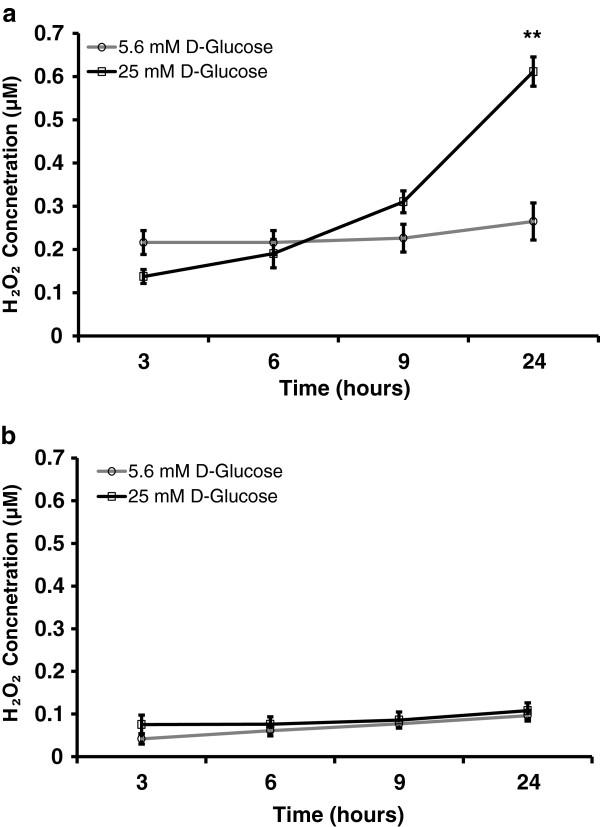
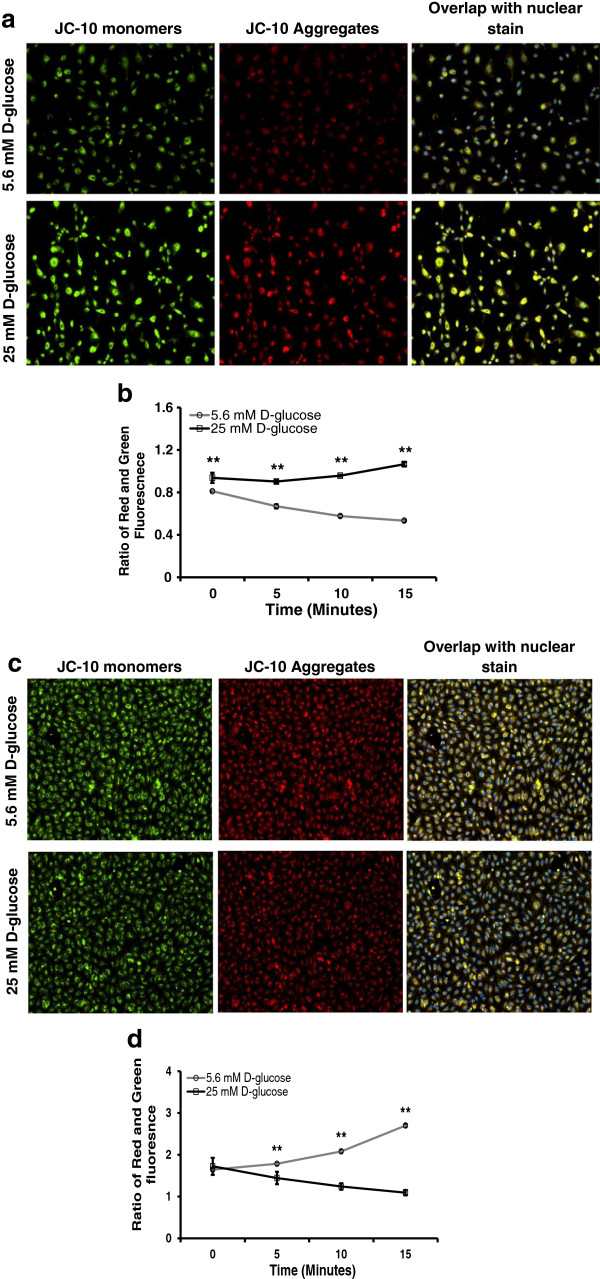
Method: Gene expression of NOS2, NOS3, NOX4, CYBA, UCP1, CAT, TXNRD1, TXNRD2, GPX1, NOX1, SOD1, SOD2, PRDX1, 18s, and RPLP0 were measured using real-time PCR. O₂⁻ production was measured with dihydroethidium (DHE) fluorescence measurement. H2O2 production was measured using Amplex Red assay. Mitochondrial membrane polarization was measured using JC-10 based fluorescence measurement.
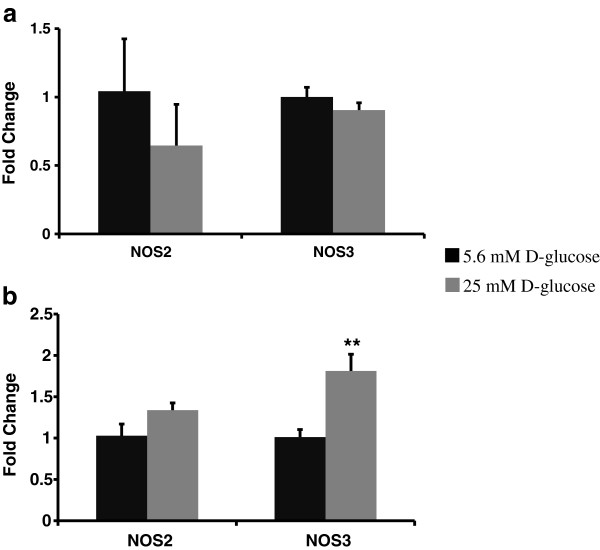
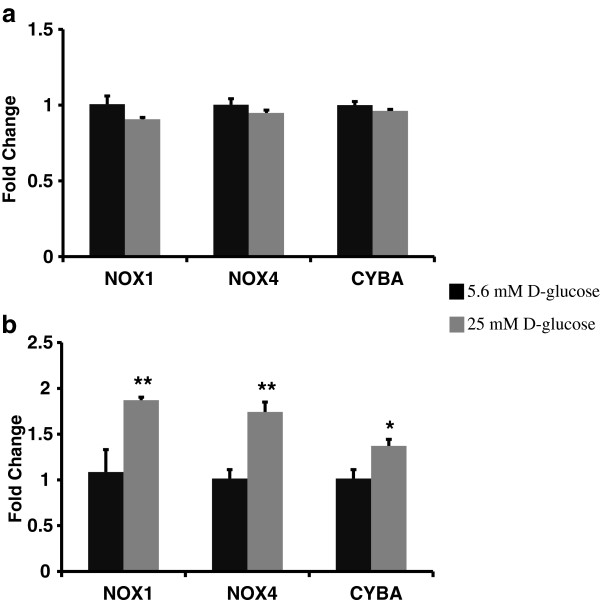
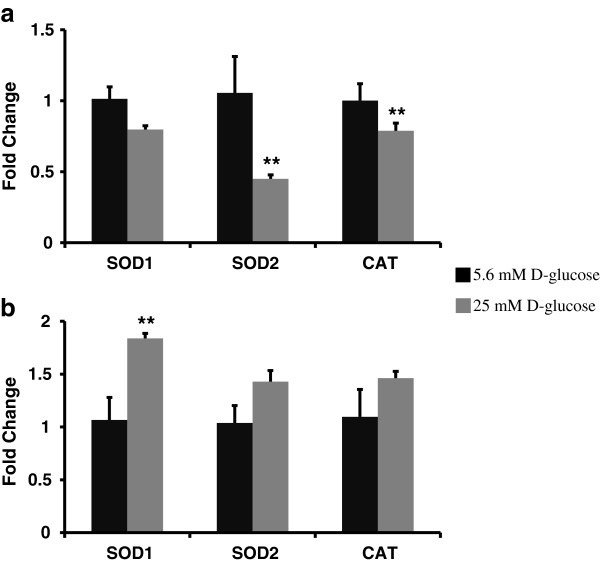
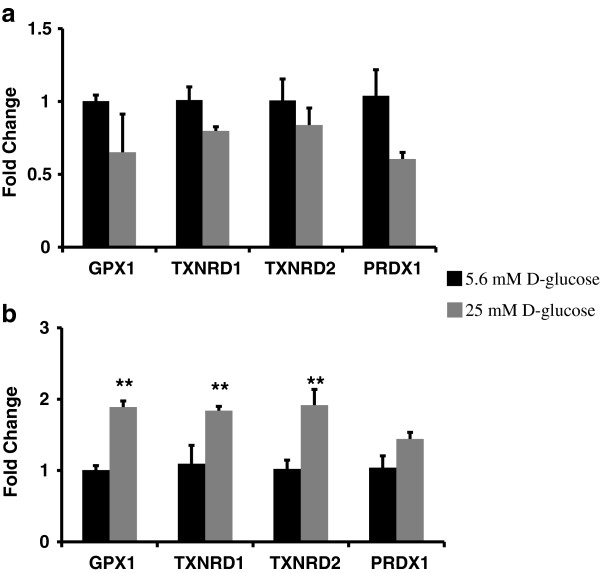
Results: We showed that the O₂⁻ levels increased similarly in both ECs with hyperglycemia. However, these endothelial cells showed significantly different underlying gene expression profile, H₂O₂ production and mitochondrial membrane polarization. In HUVEC, hyperglycemia increased H₂O₂ production, and hyperpolarized mitochondrial membrane. ROS neutralizing enzymes SOD2 and CAT gene expression were downregulated. In contrast, there was an upregulation of nitric oxide synthase and NAD(P)H oxidase and a depolarization of mitochondrial membrane in HMVEC. In addition, ROS neutralizing enzymes SOD1, GPX1, TXNRD1 and TXNRD2 gene expression were significantly upregulated in high glucose treated HMVEC.
Conclusion: Our findings highlighted a unique framework for hyperglycemia-induced endothelial dysfunction. We showed that multiple pathways are differentially affected in these endothelial cells in hyperglycemia. High occurrences of gene expression changes in HMVEC in this study supports the hypothesis that microvasculature precedes macrovasculature in epigenetic regulation forming vascular metabolic memory. Identifying genomic phenotype and corresponding functional changes in hyperglycemic endothelial dysfunction will provide a suitable systems biology approach for understanding underlying mechanisms and possible effective therapeutic intervention.
Figures

Similar articles
-
Nox4 is a protective reactive oxygen species generating vascular NADPH oxidase.Circ Res. 2012 Apr 27;110(9):1217-25. doi: 10.1161/CIRCRESAHA.112.267054. Epub 2012 Mar 27. Circ Res. 2012. PMID: 22456182
-
Induced peroxidase and cytoprotective enzyme expressions support adaptation of HUVECs to sustain subsequent H2O2 exposure.Microvasc Res. 2016 Jan;103:1-10. doi: 10.1016/j.mvr.2015.09.003. Epub 2015 Sep 25. Microvasc Res. 2016. PMID: 26409120 Free PMC article.
-
Resveratrol reduces endothelial oxidative stress by modulating the gene expression of superoxide dismutase 1 (SOD1), glutathione peroxidase 1 (GPx1) and NADPH oxidase subunit (Nox4).J Physiol Pharmacol. 2009 Oct;60 Suppl 4:111-6. J Physiol Pharmacol. 2009. PMID: 20083859
-
Oxidative Stress and Mitochondrial Dysfunction Associated with Peripheral Neuropathy in Type 1 Diabetes.Antioxid Redox Signal. 2022 Sep;37(7-9):578-596. doi: 10.1089/ars.2021.0152. Epub 2021 Dec 7. Antioxid Redox Signal. 2022. PMID: 34416846 Review.
-
Regulation of endothelial function by mitochondrial reactive oxygen species.Antioxid Redox Signal. 2011 Sep 15;15(6):1517-30. doi: 10.1089/ars.2010.3642. Epub 2011 Apr 26. Antioxid Redox Signal. 2011. PMID: 21194353 Free PMC article. Review.
Cited by
-
Endothelial Dysfunction and Diabetic Cardiomyopathy.Front Endocrinol (Lausanne). 2022 Apr 7;13:851941. doi: 10.3389/fendo.2022.851941. eCollection 2022. Front Endocrinol (Lausanne). 2022. PMID: 35464057 Free PMC article. Review.
-
RAGE Differentially Altered in vitro Responses in Vascular Smooth Muscle Cells and Adventitial Fibroblasts in Diabetes-Induced Vascular Calcification.Front Physiol. 2021 Jun 7;12:676727. doi: 10.3389/fphys.2021.676727. eCollection 2021. Front Physiol. 2021. PMID: 34163373 Free PMC article.
-
Vascular nitric oxide resistance in type 2 diabetes.Cell Death Dis. 2023 Jul 11;14(7):410. doi: 10.1038/s41419-023-05935-5. Cell Death Dis. 2023. PMID: 37433795 Free PMC article. Review.
-
Maternal diabetes induces autism-like behavior by hyperglycemia-mediated persistent oxidative stress and suppression of superoxide dismutase 2.Proc Natl Acad Sci U S A. 2019 Nov 19;116(47):23743-23752. doi: 10.1073/pnas.1912625116. Epub 2019 Nov 4. Proc Natl Acad Sci U S A. 2019. PMID: 31685635 Free PMC article.
-
Curcumin, Polydatin and Quercetin Synergistic Activity Protects from High-Glucose-Induced Inflammation and Oxidative Stress.Antioxidants (Basel). 2022 May 24;11(6):1037. doi: 10.3390/antiox11061037. Antioxidants (Basel). 2022. PMID: 35739934 Free PMC article.
References
-
- Haring R, Wallaschofski H, Nauck M, Felix SB, Schmidt CO, Dorr M, Sauer S, Wilmking G, Volzke H. Total and cardiovascular disease mortality predicted by metabolic syndrome is inferior relative to its components. Exp Clin Endocrinol Diab. 2010;118(10):685–691. - PubMed
-
- Kassab A, Piwowar A. Cell oxidant stress delivery and cell dysfunction onset in type 2 diabetes. Biochimie. 2012;94(9):1837–1848. - PubMed
-
- Anderson TJ. Assessment and treatment of endothelial dysfunction in humans. J Am Coll Cardiol. 1999;34(3):631–638. - PubMed
Publication types
MeSH terms
Substances
Grants and funding
LinkOut - more resources
Full Text Sources
Other Literature Sources
Medical
Miscellaneous
