Coadministration of polyinosinic:polycytidylic acid and immunostimulatory complexes modifies antigen processing in dendritic cell subsets and enhances HIV gag-specific T cell immunity
- PMID: 24089189
- PMCID: PMC4100557
- DOI: 10.4049/jimmunol.1301730
Coadministration of polyinosinic:polycytidylic acid and immunostimulatory complexes modifies antigen processing in dendritic cell subsets and enhances HIV gag-specific T cell immunity
Abstract
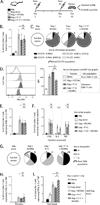
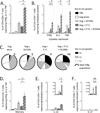
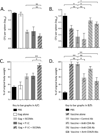
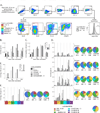
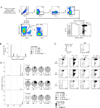
Currently approved adjuvants induce protective Ab responses but are more limited for generating cellular immunity. In this study, we assessed the effect of combining two adjuvants with distinct mechanisms of action on their ability to prime T cells: the TLR3 ligand, polyinosinic:polycytidylic acid (poly I:C), and immunostimulatory complexes (ISCOMs). Each adjuvant was administered alone or together with HIV Gag protein (Gag), and the magnitude, quality, and phenotype of Gag-specific T cell responses were assessed. For CD8 T cells, all adjuvants induced a comparable response magnitude, but combining poly I:C with ISCOMs induced a high frequency of CD127(+), IL-2-producing cells with decreased expression of Tbet compared with either adjuvant alone. For CD4 T cells, combining poly I:C and ISCOMs increased the frequency of multifunctional cells, producing IFN-γ, IL-2, and TNF, and the total magnitude of the response compared with either adjuvant alone. CD8 or CD4 T cell responses induced by both adjuvants mediated protection against Gag-expressing Listeria monocytogenes or vaccinia viral infections. Poly I:C and ISCOMs can alter Ag uptake and/or processing, and we therefore used fluorescently labeled HIV Gag and DQ-OVA to assess these mechanisms, respectively, in multiple dendritic cell subsets. Poly I:C promoted uptake and retention of Ag, whereas ISCOMs enhanced Ag degradation. Combining poly I:C and ISCOMs caused substantial death of dendritic cells but persistence of degraded Ag. These data illustrate how combining adjuvants, such as poly I:C and ISCOMs, that modulate Ag processing and have potent innate activity, can enhance the magnitude, quality, and phenotype of T cell immunity.
Figures

Similar articles
-
Dendritic cell maturation enhances CD8+ T-cell responses to exogenous antigen via a proteasome-independent mechanism of major histocompatibility complex class I loading.Immunology. 2003 Jul;109(3):374-83. doi: 10.1046/j.1365-2567.2003.01664.x. Immunology. 2003. PMID: 12807483 Free PMC article.
-
The role of antigen-presenting cells and interleukin-12 in the priming of antigen-specific CD4+ T cells by immune stimulating complexes.Immunology. 2003 Sep;110(1):95-104. doi: 10.1046/j.1365-2567.2003.01705.x. Immunology. 2003. PMID: 12941146 Free PMC article.
-
Comparing adjuvanted H28 and modified vaccinia virus ankara expressingH28 in a mouse and a non-human primate tuberculosis model.PLoS One. 2013 Aug 19;8(8):e72185. doi: 10.1371/journal.pone.0072185. eCollection 2013. PLoS One. 2013. PMID: 23977248 Free PMC article.
-
Vaccination with a fusion protein that introduces HIV-1 gag antigen into a multitrimer CD40L construct results in enhanced CD8+ T cell responses and protection from viral challenge by vaccinia-gag.J Virol. 2014 Feb;88(3):1492-501. doi: 10.1128/JVI.02229-13. Epub 2013 Nov 13. J Virol. 2014. PMID: 24227853 Free PMC article.
-
Dendritic cell-targeted protein vaccines: a novel approach to induce T-cell immunity.J Intern Med. 2012 Feb;271(2):183-92. doi: 10.1111/j.1365-2796.2011.02496.x. Epub 2012 Jan 4. J Intern Med. 2012. PMID: 22126373 Free PMC article. Review.
Cited by
-
Different antigen-processing activities in dendritic cells, macrophages, and monocytes lead to uneven production of HIV epitopes and affect CTL recognition.J Immunol. 2014 Nov 1;193(9):4322-4334. doi: 10.4049/jimmunol.1400491. Epub 2014 Sep 17. J Immunol. 2014. PMID: 25230751 Free PMC article.
-
Mucosal Vaccine Approaches for Prevention of HIV and SIV Transmission.Curr Immunol Rev. 2019;15(1):102-122. doi: 10.2174/1573395514666180605092054. Curr Immunol Rev. 2019. PMID: 31452652 Free PMC article.
-
Adjuvants and myeloid-derived suppressor cells: enemies or allies in therapeutic cancer vaccination.Hum Vaccin Immunother. 2014;10(11):3251-60. doi: 10.4161/hv.29847. Hum Vaccin Immunother. 2014. PMID: 25483674 Free PMC article. Review.
-
Advances in aluminum hydroxide-based adjuvant research and its mechanism.Hum Vaccin Immunother. 2015;11(2):477-88. doi: 10.1080/21645515.2014.1004026. Hum Vaccin Immunother. 2015. PMID: 25692535 Free PMC article. Review.
-
Toll-like receptor 3-induced immune response by poly(d,l-lactide-co-glycolide) nanoparticles for dendritic cell-based cancer immunotherapy.Int J Nanomedicine. 2016 Nov 2;11:5729-5742. doi: 10.2147/IJN.S109001. eCollection 2016. Int J Nanomedicine. 2016. PMID: 27843314 Free PMC article.
References
-
- Hansen SG, Ford JC, Lewis MS, Ventura AB, Hughes CM, Coyne-Johnson L, Whizin N, Oswald K, Shoemaker R, Swanson T, Legasse AW, Chiuchiolo MJ, Parks CL, Axthelm MK, Nelson JA, Jarvis MA, Piatak M, Lifson JD, Picker LJ. Profound early control of highly pathogenic SIV by an effector memory T-cell vaccine. Nature. 2011;473:523–527. - PMC - PubMed
-
- Epstein JE, Tewari K, Lyke KEL, Sim BK, Billingsley PF, Laurens MB, Gunasekera A, Chakravarty S, James ER, Sedegah M, Richman A, Velmurugan S, Reyes S, Li M, Tucker K, Ahumada A, Ruben AJ, Li T, Stafford R, Eappen AG, Tamminga C, Bennett JW, Ockenhouse CF, Murphy JR, Komisar J, Thomas N, Loyevsky M, Birkett A, Plowe CV, Loucq C, Edelman R, Richie TL, Seder RA, Hoffman SL. Live attenuated malaria vaccine designed to protect through hepatic CD8+ T cell immunity. Science. 2011;334:475–480. - PubMed
-
- Abel B, Tameris M, Mansoor N, Gelderbloem S, Hughes J, Abrahams D, Makhethe L, Erasmus M, de Kock M, van der Merwe L, Hawkridge A, Veldsman A, Hatherill M, Schirru G, Pau MG, Hendriks J, Weverling GJ, Goudsmit J, Sizemore D, McClain JB, Goetz M, Gearhart J, Mahomed H, Hussey GD, Sadoff JC, Hanekom WA. The novel tuberculosis vaccine, AERAS-402, induces robust and polyfunctional CD4+ and CD8+ T cells in adults. Am. J. Respir. Crit. Care Med. 2010;181:1407–1417. - PMC - PubMed
Publication types
MeSH terms
Substances
Grants and funding
LinkOut - more resources
Full Text Sources
Other Literature Sources
Molecular Biology Databases
Research Materials

