. 2013 Oct 17;5(1):151-65.
doi: 10.1016/j.celrep.2013.08.026. Epub 2013 Sep 26.

Alternative spliceosome assembly pathways revealed by single-molecule fluorescence microscopy

Affiliations

Alternative spliceosome assembly pathways revealed by single-molecule fluorescence microscopy

Inna Shcherbakova et al. Cell Rep. .

Abstract

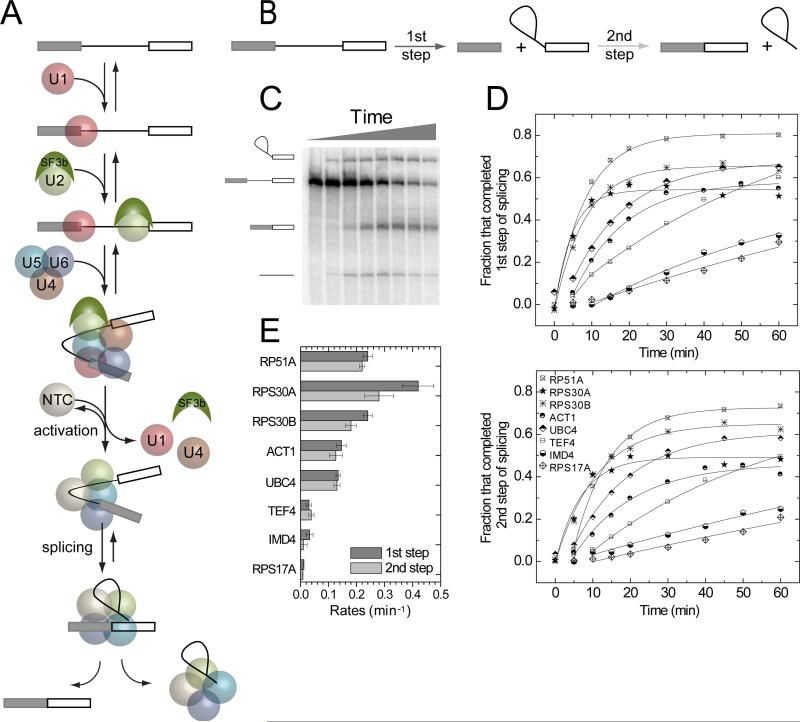
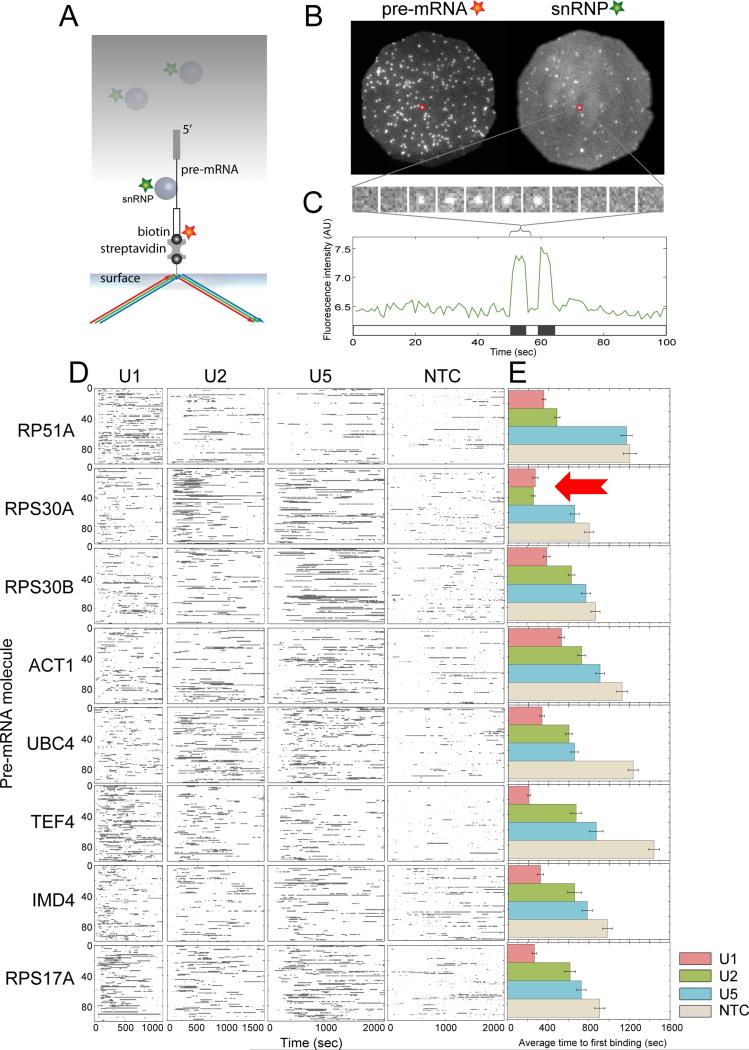
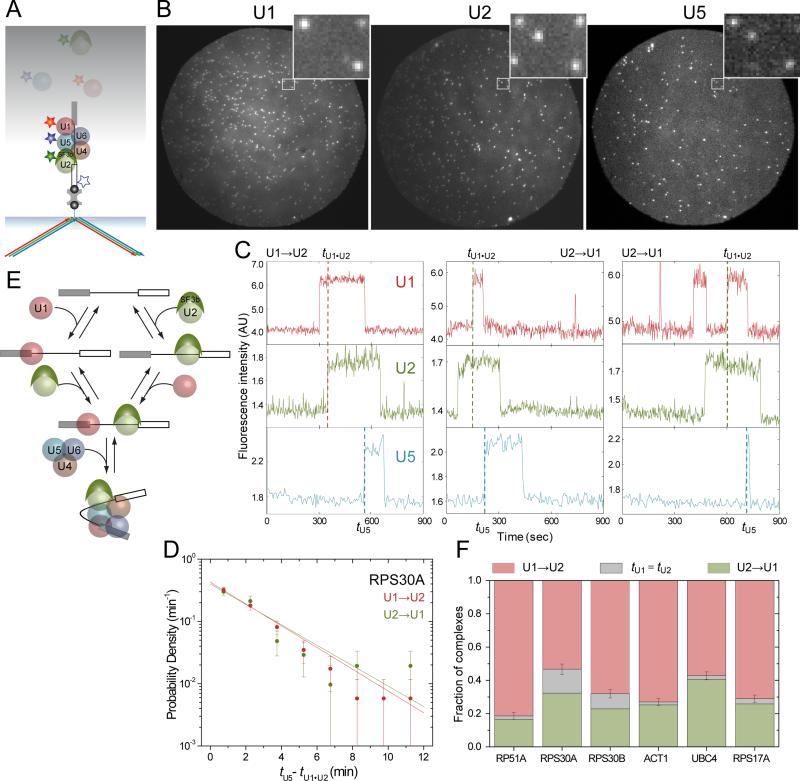
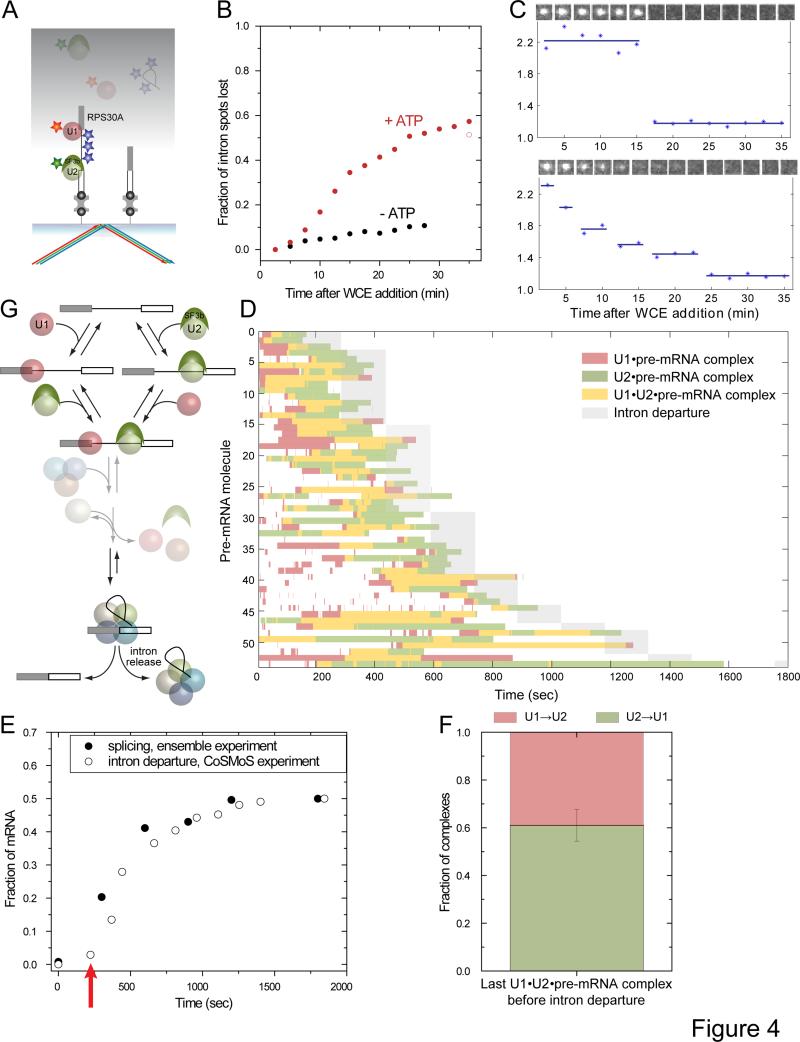
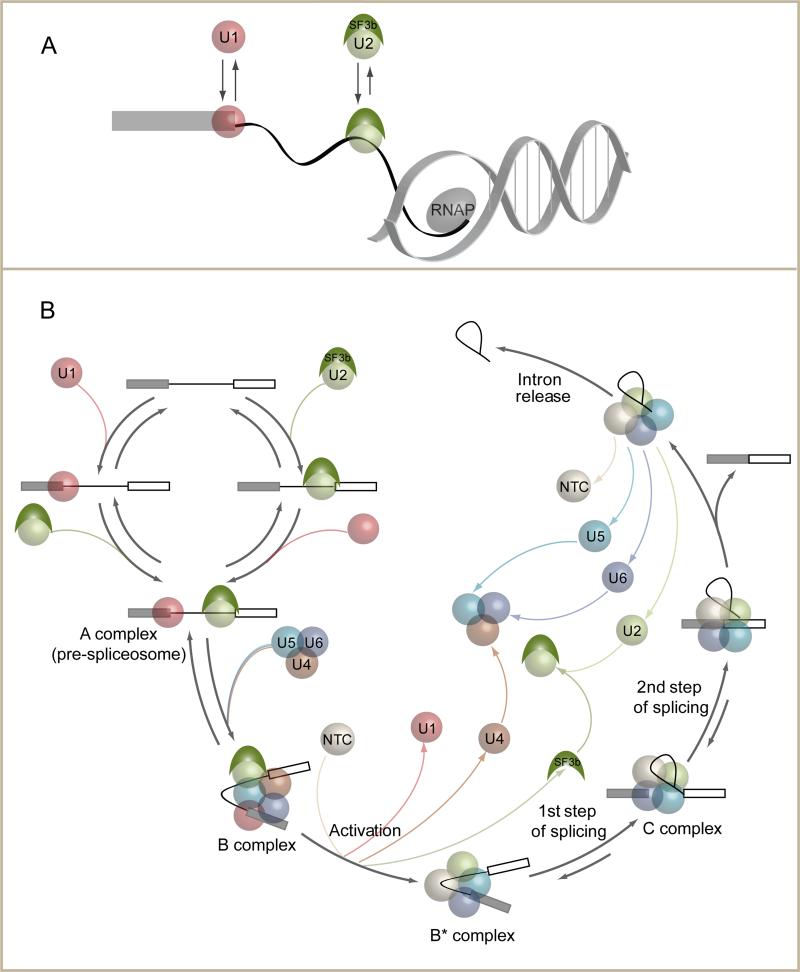
Removal of introns from nascent transcripts (pre-mRNAs) by the spliceosome is an essential step in eukaryotic gene expression. Previous studies have suggested that the earliest steps in spliceosome assembly in yeast are highly ordered and the stable recruitment of U1 small nuclear ribonucleoprotein particle (snRNP) to the 5' splice site necessarily precedes recruitment of U2 snRNP to the branch site to form the "prespliceosome." Here, using colocalization single-molecule spectroscopy to follow initial spliceosome assembly on eight different S. cerevisiae pre-mRNAs, we demonstrate that active yeast spliceosomes can form by both U1-first and U2-first pathways. Both assembly pathways yield prespliceosomes functionally equivalent for subsequent U5·U4/U6 tri-snRNP recruitment and for intron excision. Although fractional flux through the two pathways varies on different introns, both are operational on all introns studied. Thus, multiple pathways exist for assembling functional spliceosomes. These observations provide insight into the mechanisms of cross-intron coordination of initial spliceosome assembly.


Figures

Figure 1
Figure 1
Splicing of S. cerevisiae pre-mRNAs studied in ensemble experimentsin vitro. (A) Spliceosome assembly and splicing pathway for RP51A pre-mRNA (Hoskins et al., 2011). Rectangles, exons; line, intron.(B)Cartoon showing the first and second chemical steps of splicing. (C) Products of the first and second step reactions of radioactively-labeled RP51A pre-mRNAincubated with WCE in the presence of ATPfor 0 – 60 min and visualized by denaturing PAGE. (D)Fraction of molecules that completed the first and second steps of splicing for eight different pre-mRNAs as a function of incubation time. (E) Compiled first (darker bars) and second step (lighter bars) rates (±S.E.) for the specified pre-mRNAs.
Figure 2
Figure 2
Recruitment of individual spliceosomalsubcomplexes to single surface-tethered pre-mRNA molecules observed by CoSMoS.(A)Experimental design.Spliceosomalsubcomplexes (circles) labeled with a green dye (star) colocalized with surface-tethered pre-mRNA moleculeslabeled with a red dye (star) were visualized by total internal reflection fluorescence (TIRF) microscopy using excitation with red and green lasers (arrows). Subcomplexes free in bulk solution (gray shading) were not detected. (B) Example CoSMoS data showing binding of U1 snRNP to ACT1 premRNA. Fluorescence emission from a single field of view (diameter 24 μm) was separated to produce images of pre-mRNA and U1 snRNP molecules. Individual molecules are detected as discrete spots of fluorescence; red squares mark an example of a pre-mRNA molecule with U1 bound. (C) Top: part of the time series of U1 fluorescence images taken from the location of the pre-mRNA molecule marked in (B) (1 sec per frame). Bottom: Complete time record of U1 fluorescence from the same premRNA. Intervals in which U1 is colocalized with the pre-mRNA are indicated as black bands on the time ribbon. (D)Rastergrams (stacked time ribbonsfor multiple individual pre-mRNA molecules) summarizing the recruitment of the U1, U2, U5 and NTC by eight different pre-mRNAs. Each rastergram shows data on 100 pre-mRNA molecules taken from a separate experiment (32 experiments total). Only the first 1100, 1600, 2000, and 2000 sec of data are shown for U1, U2, U5 and NTC, respectively. (E). Average time (±S.E.M.) to first binding of the indicated subcomplex to each pre-mRNA molecule. See also Figure S1.
Figure 3
Figure 3
Sequence of U1, U2 and U5 binding to surface-tethered pre-mRNAs. (A) Experimental design. Surface-tethered pre-mRNA was labeled with a blue fluorophore that was used to monitor pre-mRNA surface density. Before the experiment this fluorophorewasphotobleached (white star with blue outline) so as not to interfere with detection of U5 fluorescence. U1, U2 and U5 in WCE were each dye labeled; binding to the pre-mRNA was detected with red, green, and blue lasers respectively. Only events in which formation of a U1•U2•pre-mRNA pre-spliceosome was followed by U5 binding were selected for analysis. (B)Example images. Fluorescence of U1 (left), U2 (center) and U5(right) wasrecorded from a single field of view at 1,110 seconds after addition of triple-labeled WCE containing ATP to a chamber with surface-immobilized UBC4 premRNA. Insets show magnified images from the same 3.54 × 2.93 μm area of the chamber surface (white frames). (C) Example segments of fluorescence recordsof U1, U2, and U5 binding to three RPS30A pre-mRNA molecules. Pre-spliceosome formation by the U1→U2 (red dashed line) and U2→U1 (green dashed line) pathways is marked.(D) Distribution (± S.E.) of the time intervals (tU5tU1•U2) between the formation of the U1•U2•RPS30A pre-mRNA complex and the binding of U5. Pre-spliceosomes that formed by the U1→U2 (red) and U2→U1 (green) pathways were analyzed separately;exponential fits (lines) yielded apparent first-order rate constants for U5 binding to the U1•U2•pre-mRNA complex of 0.40 ± 0.05 and 0.36 ± 0.06 min-1, respectively.(E)Summary of the pathways observed in this experiment.Spliceosome assembly up to B complex (bottom) can occur via both U1→U2 and U2→U1 branches. (F)Fraction of complexes that formed through the U1→U2 (red) or U2→U1 (green) pathways or for which the pathway was indeterminate (gray).See also Figure S2.
Figure 4
Figure 4
Splicing of RPS30A pre-mRNAs through alternative pre-spliceosome assembly pathways. (A) Experimental design.Binding of labeledU1 and U2 was visualized with red and green excitation. The intron of each pre-mRNA molecule was labeled with 8 dye molecules on average; intron release was detected as loss of blue-excited fluorescence. (B) Fraction of intron fluorescent spots lostfrom a single field of view at various times after adding WCE with ATP (red; N = 923) or without ATP (black; N = 1272). The open red symbol is a photobleaching-independent estimate (average N = 474 ± 12 spot per field of view after 35 min; see Experimental Procedures(C)Time records of intron fluorescence loss in WCE+ATP. Top, an example of fluorescence loss that occurs in a single step, presumably due to splicing.Bottom, fluorescence loss in multiple steps, presumably due to photobleaching.Insets: Gallery of the images (1.34 × 1.34 μm) corresponding to each time point. (D)Rastergram summarizing the presence of fluorescent U1 (red) or U2 (green) snRNPs, or both (yellow), onindividual RPS30A pre-mRNA molecules.Only pre-mRNAs that were observed to loseintron fluorescence in a large step, presumably due to the intron departure,were selected for analysis (N = 54).Records are ordered by the time interval in which intron departure occurred (shading).(E)Time courses of intron departure (open symbols;from CoSMoS experiment) and the second step of splicing (filledsymbols;from ensemble experiment). The red arrow indicates an apparent lag in the intron departure detected in the CoSMoS experiments (see text). (F) Genesis of the U1•U2•pre-mRNA complex that most closely preceded intron departure from each pre-mRNA molecule in (D). Fractions of complexes formed through the U1→U2 (red) or U2→U1 (green) pathways are indicated.(G) Summary of the pathways observed in this experiment.Catalysis of splicing and subsequent intron release can occur through pre-spliceosomes assembled by both U1→U2 and U2→U1 branches.
Figure 5
Figure 5
Implications of alternative pathways for U1 and U2 addition.(A) Cotranscriptional pre-spliceosome formation.RNA polymerase II (RNAP) transcribes the5’ SS before the BS, providing U1 an opportunity to bind prior to U2, but this may not dictate which binds first to form the pre-spliceosome (see text).(B)Spliceosome cycle – 2013. Overall pathway foryeast spliceosome assembly, activationand splicing incorporating both U1→U2 and U2→U1 branches and known reversibilities(Hoskins et al., 2011; Tseng and Cheng, 2008).

Similar articles

Cited by

References

    1. Abelson J, Blanco M, Ditzler MA, Fuller F, Aravamudhan P, Wood M, Villa T, Ryan DE, Pleiss JA, Maeder C, et al. Conformational dynamics of single pre-mRNA molecules during in vitro splicing. Nature Structural & Molecular Biology. 2010;17:504–512. - PMC - PubMed
    1. Crawford DJ, Hoskins AA, Friedman LJ, Gelles J, Moore MJ. Visualizing the splicing of single pre-mRNA molecules in whole cell extract. RNA. 2008;14:170–179. - PMC - PubMed
    1. Crispino JD, Blencowe BJ, Sharp PA. Complementation by SR proteins of pre-mRNA splicing reactions depleted of U1 snRNP. Science. 1994;265:1866–1869. - PubMed
    1. Dave R, Terry DS, Munro JB, Blanchard SC. Mitigating unwanted photophysical processes for improved single-molecule fluorescence imaging. Biophysical Journal. 2009;96:2371–2381. - PMC - PubMed
    1. David CJ, Boyne AR, Millhouse SR, Manley JL. The RNA polymerase II C-terminal domain promotes splicing activation through recruitment of a U2AF65-Prp19 complex. Genes & Development. 2011;25:972–983. - PMC - PubMed

Publication types

MeSH terms

Substances