

doi: 10.1126/science.1238724.
Epub 2013 Sep 26.
Architecture of an RNA polymerase II transcription pre-initiation complex
Affiliations
- PMID: 24072820
- PMCID: PMC4039082
- DOI: 10.1126/science.1238724
Item in Clipboard
Architecture of an RNA polymerase II transcription pre-initiation complex
Science.
.
Abstract
The protein density and arrangement of subunits of a complete, 32-protein, RNA polymerase II (pol II) transcription pre-initiation complex (PIC) were determined by means of cryogenic electron microscopy and a combination of chemical cross-linking and mass spectrometry. The PIC showed a marked division in two parts, one containing all the general transcription factors (GTFs) and the other pol II. Promoter DNA was associated only with the GTFs, suspended above the pol II cleft and not in contact with pol II. This structural principle of the PIC underlies its conversion to a transcriptionally active state; the PIC is poised for the formation of a transcription bubble and descent of the DNA into the pol II cleft.
Figures
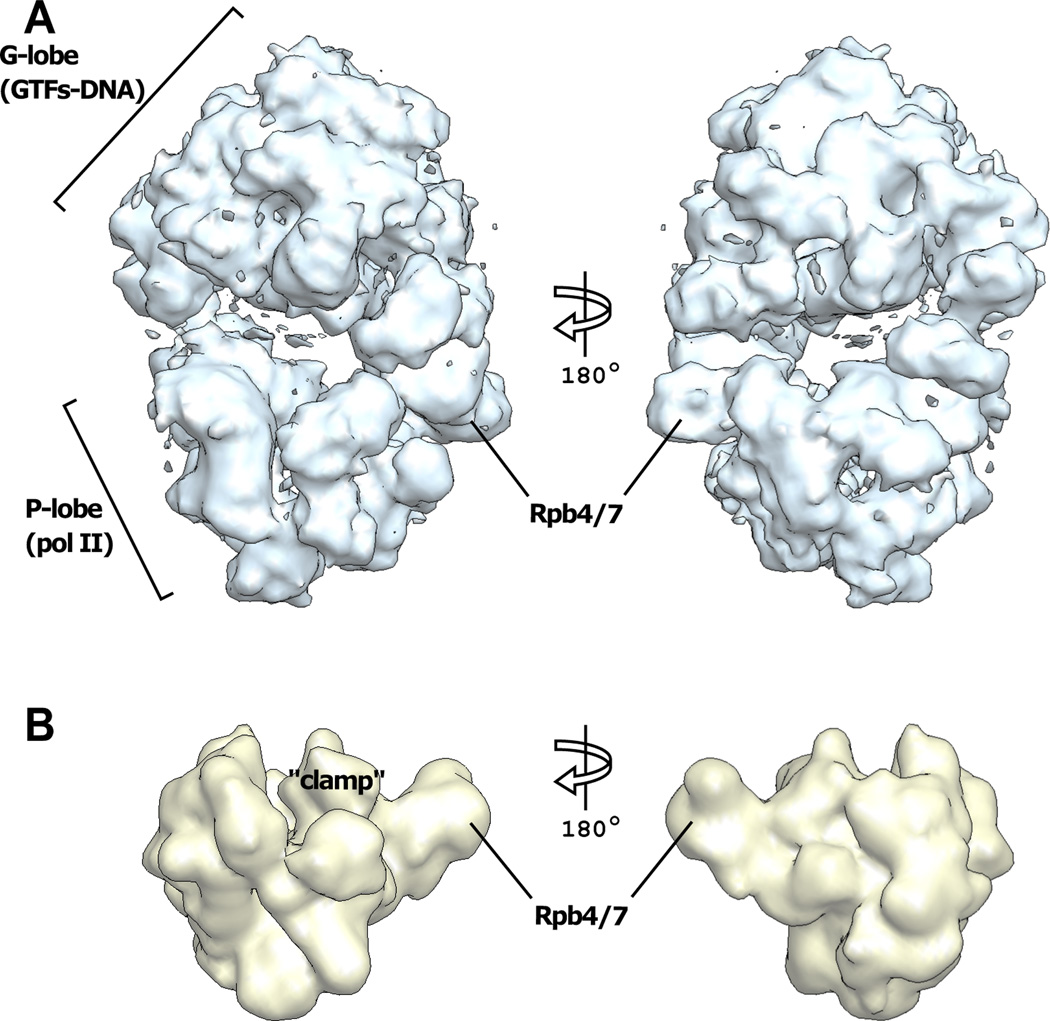
(A) Front (left panel) and back (right panel) views of the most populated state of the PIC. (B) Low-pass filtered (20 Å) 12-subunit pol II (45) is viewed in the same orientations as in (A). The mobile “clamp” domain of pol II (10) and the dissociable subunits Rpb4/7 are indicated.

(A) Front (left panel) and side (right panel) views of the PIC with suggested assignments based on comparison with (B). Core (Tfb1–4) and Rad3 are gold, Ssl2 is orange, TFIIK is lime yellow. The extra density marked by * may be due to the C-terminal domain (CTD) of Rpb1. (B) Molecular envelope from EM and 3D reconstruction of negatively stained TFIIH(20), viewed in the same orientation as the right panel of (A). (C) Front (left panel) and side (right panel) views of the PIC lacking TFIIK (PIC-ΔTFIIK). Dashed ellipses indicate the location of the density, labeled TFIIK in (A), that is not observed. (D) SDS-PAGE of peak glycerol gradient fractions of PIC (left) and PIC–ΔTFIIK (right). Rpb10, Rpb12, and Tfb5 are not seen due to their low molecular weights. The same color scheme is used in all figures.
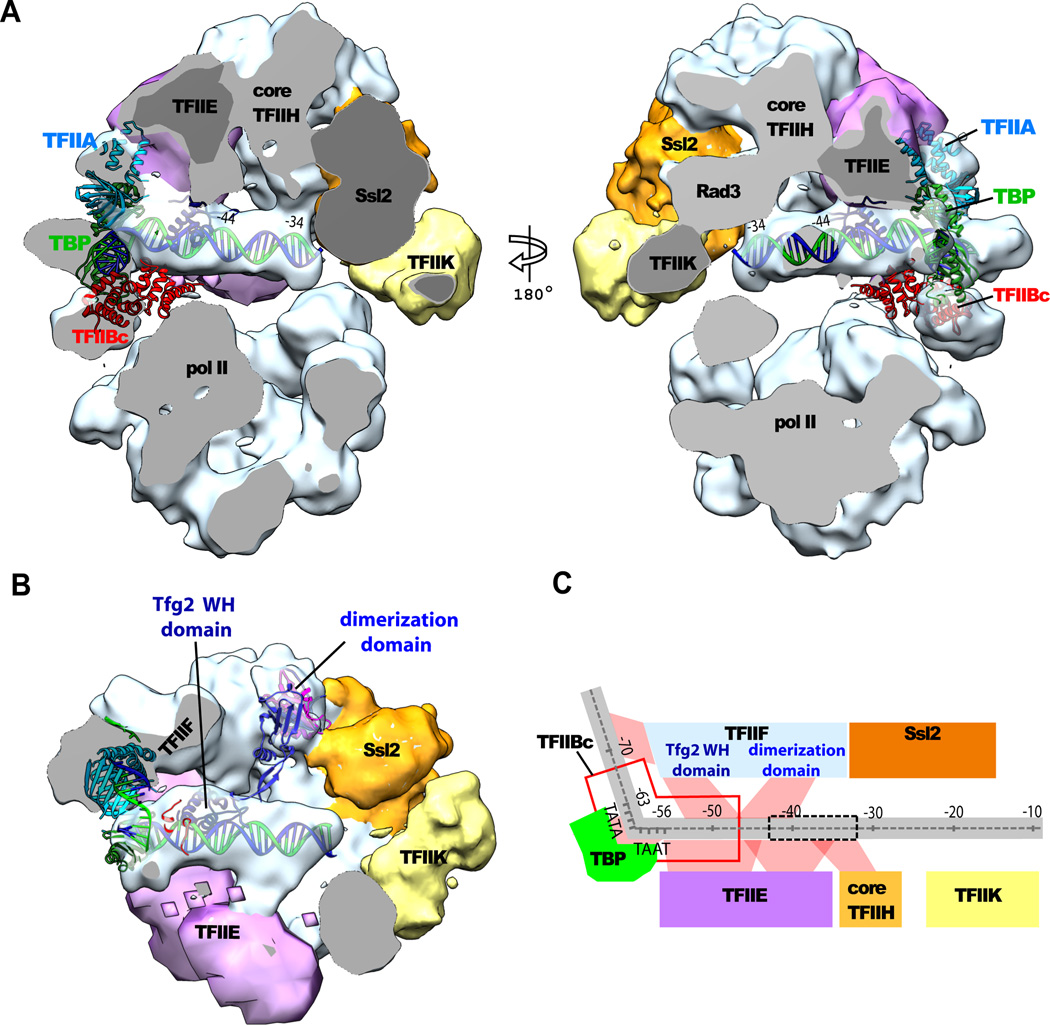
(A) The PIC structure, sectioned to reveal the DNA in the center (cut surfaces are gray). The structure on the left side of Fig. 1A was rotated 60° counterclockwise about the vertical axis (left) or 120° clockwise (right). Subunits of TFIIE and TFIIH (core TFIIH and its Rad3 component, Ssl2, and TFIIK) are indicated. Atomic models of the TBP (green)-TFIIBC(red)-TATA-box complex (15) and TFIIA (cyan) (32) were fitted to the cryo-EM density and displayed as ribbon diagrams. The TATA box DNA was extended with straight B-form DNA with minor adjustments of the DNA path. (B) The underside of the G-lobe, viewed from bottom of left panel of (A) with the P-lobe removed. Atomic models of the Tfg1-Tfg2 dimerization domain (Tfg1 blue; Tfg2 magenta) and the winged helix (WH) domain of Tfg2 (navy blue) were located by protein-protein cross-linking and displayed as ribbon diagrams. (C) Schematic diagram of proximity relationships of promoter DNA (gray) and GTFs in the PIC. Positions in the DNA are numbered with respect to the first transcription start site of the HIS4 promoter. The TATA box spans positions from −63 to −56. Transcription bubble formed upon initial promoter melting is indicated by dashed box. Putative interactions are indicated by red shading.

(A) Front view (same as Fig. 1A) of the PIC showing only the EM densities for TFIIF (light blue) and TFIIE (light purple). Pol II domains (jaw-lobe, cyan; clamp, yellow; core, gray ; shelf, magenta), TFIIA (cyan), TFIIB (red), and TBP (green) are represented as backbone traces. Lysine residues of pol II and one of TBP that form cross-links to TFIIE and TFIIF are marked by van de Waals spheres and colored according to the subunit to which they are cross-linked (Tfg1, blue; Tfg2, magenta; TFIIE, purple; Ssl2, orange). If the cross-linked residue is absent from the model, then the closest structured residue (up to 3 residues away in the amino acid sequence) is shown in parentheses. (B) Schematic representation of cross-links (red dashed lines) involving Tfg1 and Tfg2, whose primary structures are depicted as boxes, with solid colors for regions of conserved folds. Only inter-subunit cross-links are shown. (C) Close-up view of models of the Tfg1-Tfg2 dimerization domain (Tfg1, blue; Tfg2, magenta) and the WH domain of Tfg2 (navy blue) oriented on the basis of the cross-links indicated (red dashed lines). Pol II is shown in surface representation with the same colors as in (A). The Tfg2 yeast-specific insertion loop (residues 139–211) also cross-links to the C-terminal region of Ssl2, located near K1217, 1246, and 1262 of Rpb1.
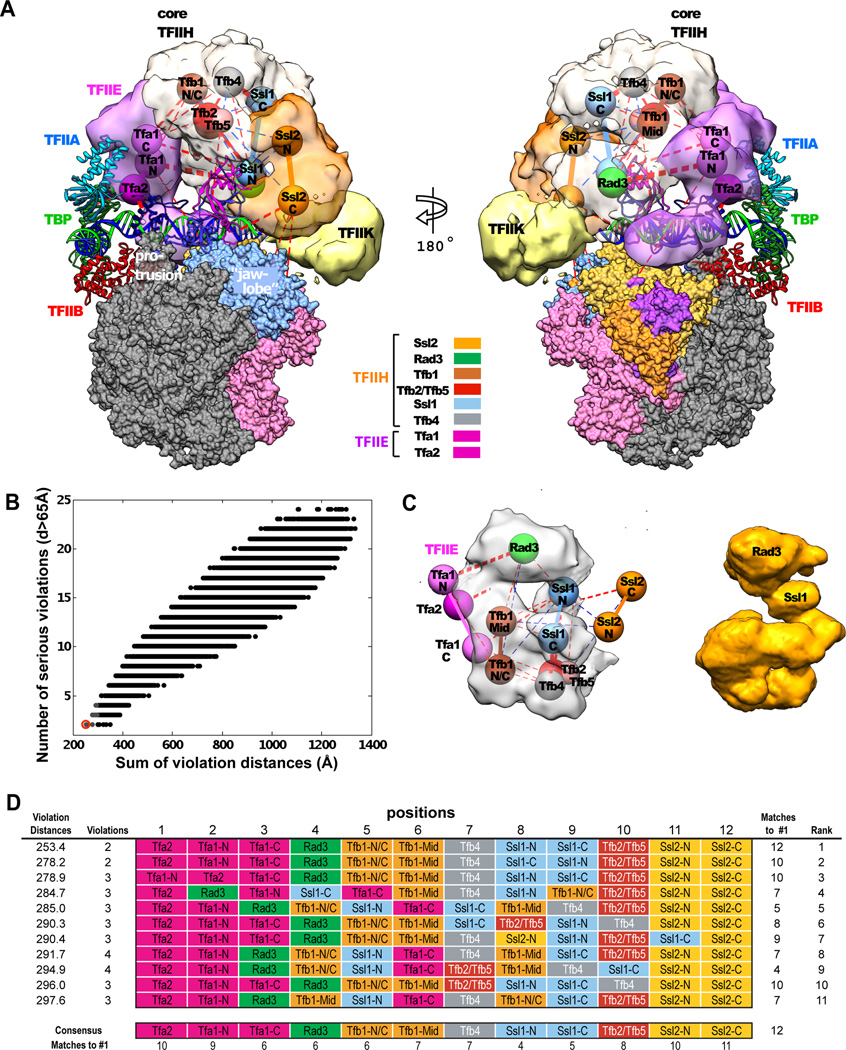
(A) Side views of PIC showing EM densities attributed to TFIIE (light purple) and TFIIH (core TFIIH, gray; Ssl2, orange; TFIIK, light yellow). Spheres for TFIIE, core TFIIH, and Ssl2 subunits are labeled according to the model that best fits the XL-MS data. Solid lines connect spheres belonging to the same subunit. Red dashed lines indicate inter-subunit cross-links in the PIC, with thicknesses proportional to the number of cross-links observed. Blue dashed lines indicate cross-links in holo-TFIIH only. The EM density for TFIIF is omitted for clarity. Other elements of the PIC are represented as in Fig. 4C. (B) Fit of various models of the subunit locations (scatter) to XL-MS data. Two measures of fit are plotted for each model: the number of cross-linked spheres that are more than 65 Å apart (y axis) and the sum of distances in excess of 40 Å between cross-linked spheres (x axis). The best-fitting model (red circle) is shown in panel A. (C) Comparison of the density for core TFIIH (left, gray) from panel A with the reconstructed volume of core TFIIH from EM of 2D crystals in stain (18) (right, light brown). Locations of TFIIE (three purple spheres) and Ssl2 (two orange spheres) from panel A are shown on the left as well. (D) Listing of the eleven best fitting models (gray scatter in B), detailing for each the assignments of the subunits to the twelve fixed positions in the electron density. Each row represents a different model, with the best-fitting model (panel A) listed at the top. The most frequently occurring subunit at each position (the consensus) is identical to that of the best-fitting model. The strength of the consensus (bottom row) is indicative of the confidence of subunit assignment.

(A) Side views of the PIC from this work. Rotated by 60° (left) or −120° (right) relative to front view in Fig. 1A. (B) The reconstruction from negatively-stained human PIC (41) is viewed in the same pol II orientation as in (A). The extra density due to TFIIH (light brown) is only weakly anchored to the remainder of the PIC. The center of mass of TFIIH is displaced by ~90 Å compared to the structure in (A). TFIIE (purple) is dissociated from TBP and TFIIH. Density due to DNA is absent.
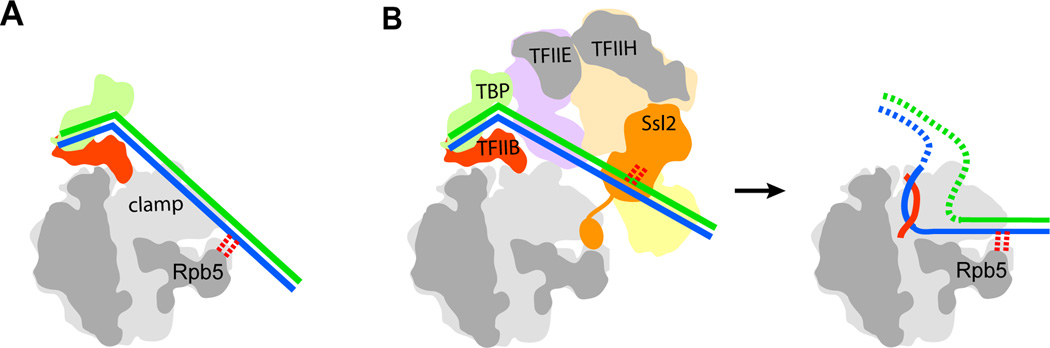
(A) Cutaway view in schematic representation of cryo-EM structure of PIC lacking TFIIE and TFIIH (41). TFIIF is omitted for clarity. DNA is blue and green. The downstream DNA contacts (red dotted lines) the tip of Rpb5. (B) Left: cutaway view in schematic representation of the complete PIC in this study. TFIIF is omitted for clarity. The C-terminal region of Ssl2 (orange appendage at the bottom of Ssl2) binds residues within the pol II cleft, preventing entry of DNA, which is instead suspended above the cleft, where it interacts with Ssl2 (red dotted lines). Right: cutaway view for the transcribing complex based on the X-ray structure (11), and contact with Rpb5 in the cleft is indicated (red dotted lines). Nascent RNA is red.
Similar articles
-
Promoter Distortion and Opening in the RNA Polymerase II Cleft.Mol Cell. 2019 Jan 3;73(1):97-106.e4. doi: 10.1016/j.molcel.2018.10.014. Epub 2018 Nov 21. Mol Cell. 2019. PMID: 30472190
-
Structural visualization of de novo transcription initiation by Saccharomyces cerevisiae RNA polymerase II.Mol Cell. 2022 Feb 3;82(3):660-676.e9. doi: 10.1016/j.molcel.2021.12.020. Epub 2022 Jan 19. Mol Cell. 2022. PMID: 35051353 Free PMC article.
-
Structural basis of RNA polymerase III transcription initiation.Nature. 2018 Jan 17;553(7688):301-306. doi: 10.1038/nature25441. Nature. 2018. PMID: 29345637
-
More pieces to the puzzle: recent structural insights into class II transcription initiation.Curr Opin Struct Biol. 2014 Feb;24:91-7. doi: 10.1016/j.sbi.2013.12.005. Epub 2014 Jan 16. Curr Opin Struct Biol. 2014. PMID: 24440461 Review.
-
Structural basis of transcription initiation by RNA polymerase II.Nat Rev Mol Cell Biol. 2015 Mar;16(3):129-43. doi: 10.1038/nrm3952. Epub 2015 Feb 18. Nat Rev Mol Cell Biol. 2015. PMID: 25693126 Review.
Cited by
-
A Conserved Nuclear Cyclophilin Is Required for Both RNA Polymerase II Elongation and Co-transcriptional Splicing in Caenorhabditis elegans.PLoS Genet. 2016 Aug 19;12(8):e1006227. doi: 10.1371/journal.pgen.1006227. eCollection 2016 Aug. PLoS Genet. 2016. PMID: 27541139 Free PMC article.
-
Epigenetic changes in the developing brain: Effects on behavior.Proc Natl Acad Sci U S A. 2015 Jun 2;112(22):6789-95. doi: 10.1073/pnas.1501482112. Proc Natl Acad Sci U S A. 2015. PMID: 26034282 Free PMC article. No abstract available.
-
Gdown1 Associates Efficiently with RNA Polymerase II after Promoter Clearance and Displaces TFIIF during Transcript Elongation.PLoS One. 2016 Oct 7;11(10):e0163649. doi: 10.1371/journal.pone.0163649. eCollection 2016. PLoS One. 2016. PMID: 27716820 Free PMC article.
-
RNAs nonspecifically inhibit RNA polymerase II by preventing binding to the DNA template.RNA. 2014 May;20(5):644-55. doi: 10.1261/rna.040444.113. Epub 2014 Mar 10. RNA. 2014. PMID: 24614752 Free PMC article.
-
In TFIIH, XPD helicase is exclusively devoted to DNA repair.PLoS Biol. 2014 Sep 30;12(9):e1001954. doi: 10.1371/journal.pbio.1001954. eCollection 2014 Sep. PLoS Biol. 2014. PMID: 25268380 Free PMC article.
References
-
- Conaway RC, Conaway JW. General initiation factors for RNA polymerase II. Annu Rev Biochem. 1993;62:161. - PubMed
-
- Kornberg RD. Mediator and the mechanism of transcriptional activation. Trends Biochem Sci. 2005 May;30:235. - PubMed
-
- Burley SK, Roeder RG. Biochemistry and structural biology of transcription factor IID (TFIID) Annu Rev Biochem. 1996;65:769. - PubMed
-
- Buratowski S, Hahn S, Guarente L, Sharp PA. Five intermediate complexes in transcription initiation by RNA polymerase II. Cell. 1989 Feb 24;56:549. - PubMed
Publication types
MeSH terms
Substances
Grants and funding
LinkOut - more resources
Full Text Sources
Other Literature Sources
Molecular Biology Databases
