

The function of vacuolar ATPase (V-ATPase) a subunit isoforms in invasiveness of MCF10a and MCF10CA1a human breast cancer cells
- PMID: 24072707
- PMCID: PMC3820907
- DOI: 10.1074/jbc.M113.503771
The function of vacuolar ATPase (V-ATPase) a subunit isoforms in invasiveness of MCF10a and MCF10CA1a human breast cancer cells
Abstract
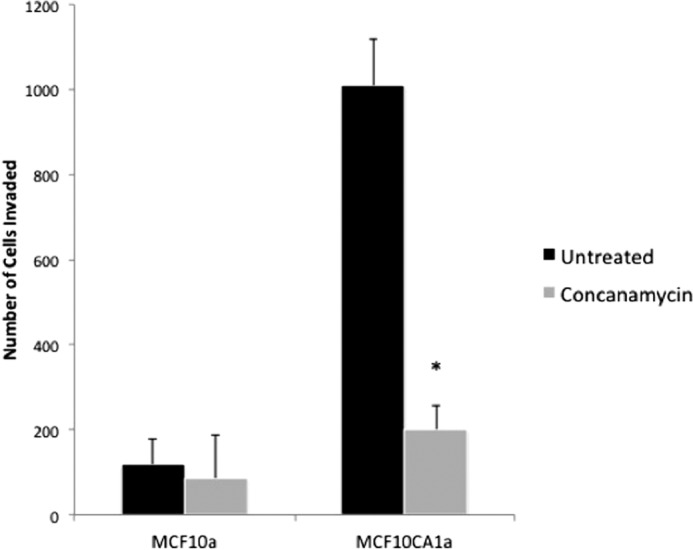
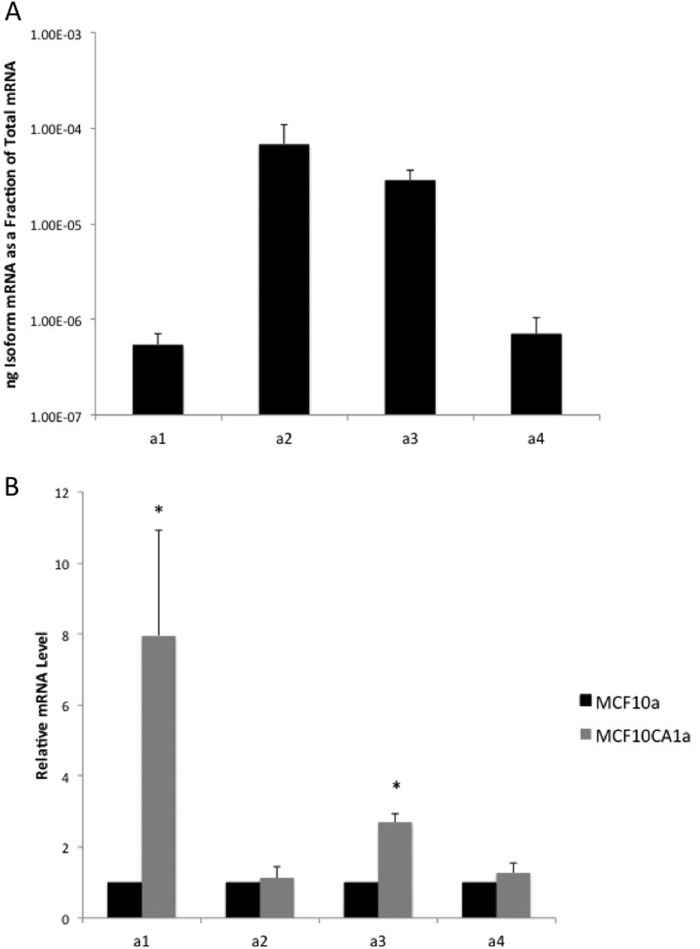
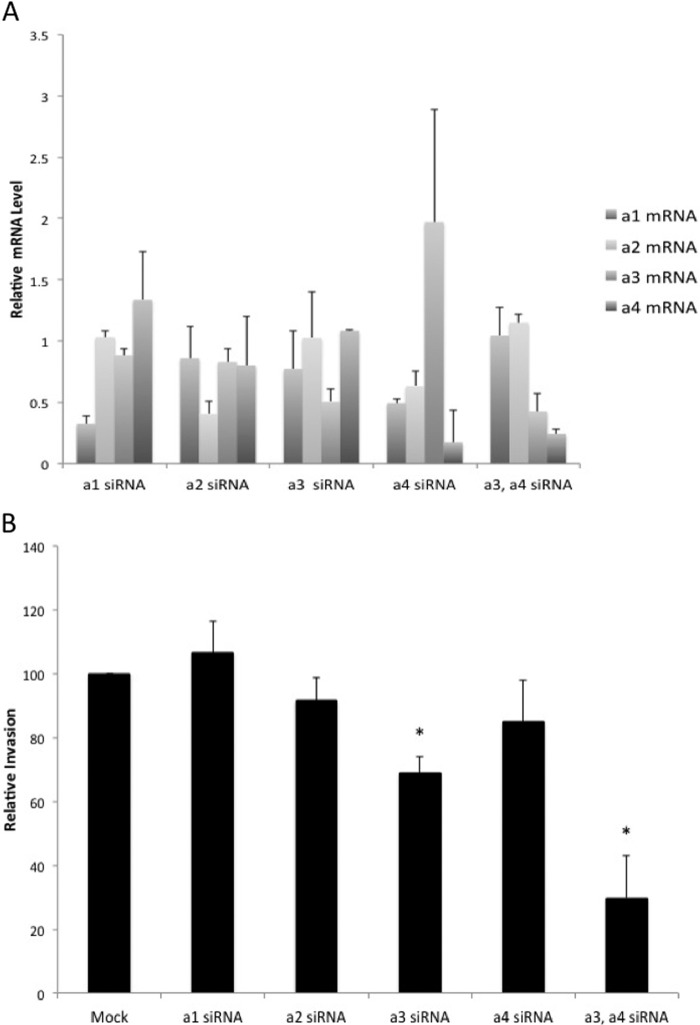
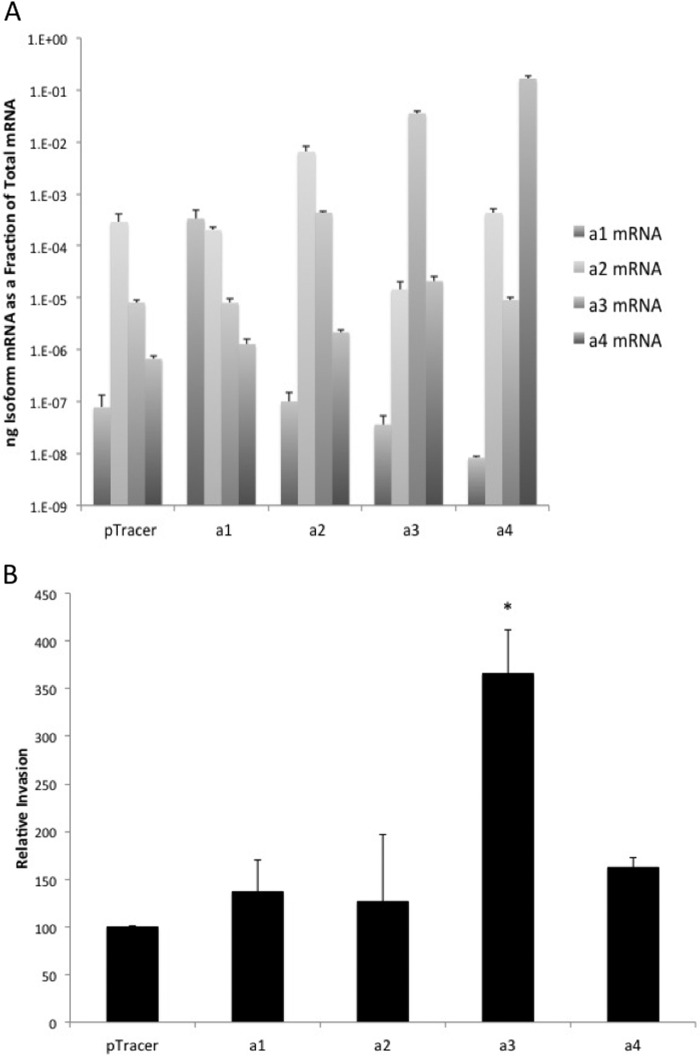
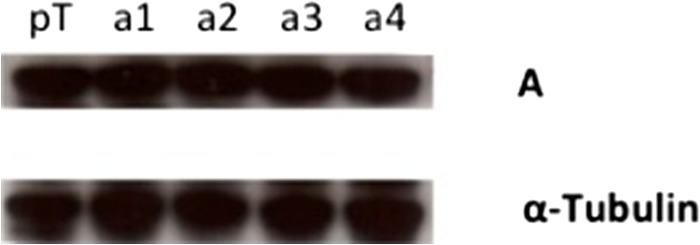
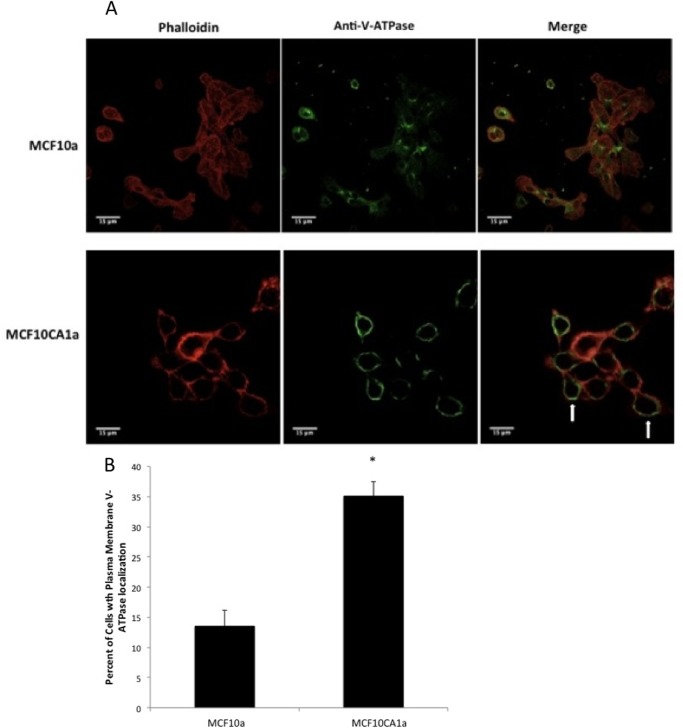
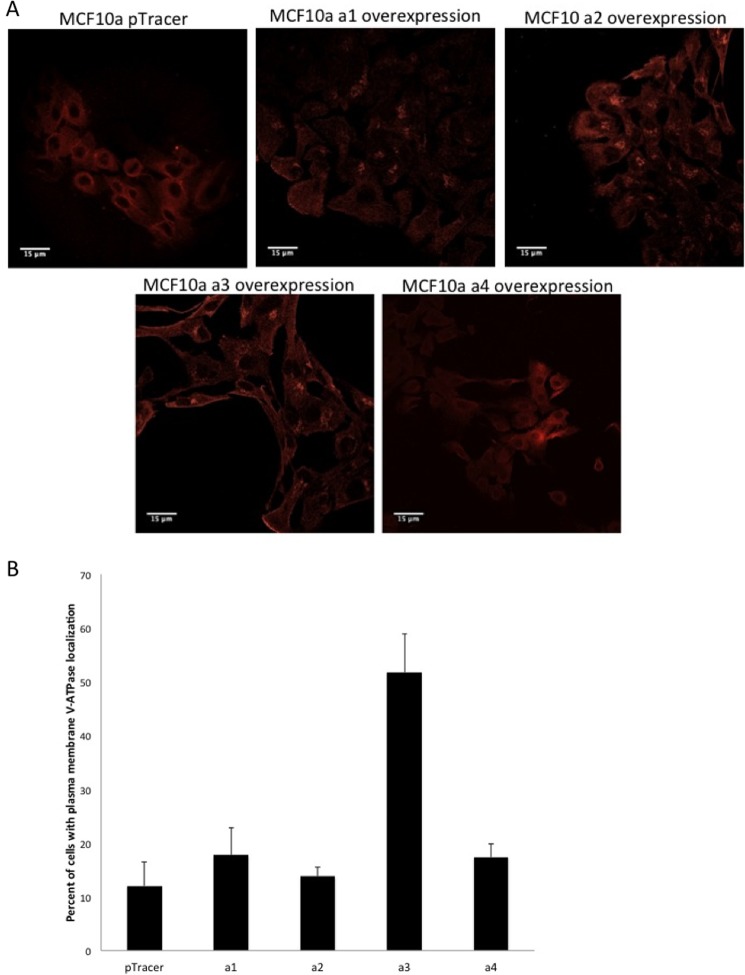
The vacuolar H(+) ATPases (V-ATPases) are ATP-driven proton pumps that transport protons across both intracellular and plasma membranes. Previous studies have implicated V-ATPases in the invasiveness of various cancer cell lines. In this study, we evaluated the role of V-ATPases in the invasiveness of two closely matched human breast cancer lines. MCF10a cells are a non-invasive, immortalized breast epithelial cell line, and MCF10CA1a cells are a highly invasive, H-Ras-transformed derivative of MCF10a cells selected for their metastatic potential. Using an in vitro Matrigel assay, MCF10CA1a cells showed a much higher invasion than the parental MCF10a cells. Moreover, this increased invasion was completely sensitive to the specific V-ATPase inhibitor concanamycin. MCF10CA1a cells expressed much higher levels of both a1 and a3 subunit isoforms relative to the parental line. Isoforms of subunit a are responsible for subcellular localization of V-ATPases, with a3 and a4 targeting V-ATPases to the plasma membrane of specialized cells. Knockdown of either a3 alone or a3 and a4 together using isoform-specific siRNAs inhibited invasion by MCF10CA1a cells. Importantly, overexpression of a3 but not the other a subunit isoforms greatly increased the invasiveness of the parental MCF10a cells. Similarly, overexpression of a3 significantly increased expression of V-ATPases at the plasma membrane. These studies suggest that breast tumor cells employ particular a subunit isoforms to target V-ATPases to the plasma membrane, where they function in tumor cell invasion.
Keywords: Bioenergetics; Breast Cancer; Invasion; Proton Pumps; Proton Transport; Vacuolar ATPase; a Subunit Isoforms.
Figures
Similar articles
-
The a3 isoform of subunit a of the vacuolar ATPase localizes to the plasma membrane of invasive breast tumor cells and is overexpressed in human breast cancer.Oncotarget. 2016 Jul 19;7(29):46142-46157. doi: 10.18632/oncotarget.10063. Oncotarget. 2016. PMID: 27323815 Free PMC article.
-
Isoform-specific gene disruptions reveal a role for the V-ATPase subunit a4 isoform in the invasiveness of 4T1-12B breast cancer cells.J Biol Chem. 2019 Jul 19;294(29):11248-11258. doi: 10.1074/jbc.RA119.007713. Epub 2019 Jun 5. J Biol Chem. 2019. PMID: 31167791 Free PMC article.
-
Function of a subunit isoforms of the V-ATPase in pH homeostasis and in vitro invasion of MDA-MB231 human breast cancer cells.J Biol Chem. 2009 Jun 12;284(24):16400-16408. doi: 10.1074/jbc.M901201200. Epub 2009 Apr 14. J Biol Chem. 2009. PMID: 19366680 Free PMC article.
-
Regulation of V-ATPase assembly and function of V-ATPases in tumor cell invasiveness.Biochim Biophys Acta. 2016 Aug;1857(8):1213-1218. doi: 10.1016/j.bbabio.2016.02.010. Epub 2016 Feb 22. Biochim Biophys Acta. 2016. PMID: 26906430 Free PMC article. Review.
-
Regulation and isoform function of the V-ATPases.Biochemistry. 2010 Jun 15;49(23):4715-23. doi: 10.1021/bi100397s. Biochemistry. 2010. PMID: 20450191 Free PMC article. Review.
Cited by
-
The V-ATPase a3 Subunit: Structure, Function and Therapeutic Potential of an Essential Biomolecule in Osteoclastic Bone Resorption.Int J Mol Sci. 2021 Jun 28;22(13):6934. doi: 10.3390/ijms22136934. Int J Mol Sci. 2021. PMID: 34203247 Free PMC article. Review.
-
Specific V-ATPase expression sub-classifies IDHwt lower-grade gliomas and impacts glioma growth in vivo.EBioMedicine. 2019 Mar;41:214-224. doi: 10.1016/j.ebiom.2019.01.052. Epub 2019 Feb 5. EBioMedicine. 2019. PMID: 30737087 Free PMC article.
-
A nanobody against the V-ATPase c subunit inhibits metastasis of 4T1-12B breast tumor cells to lung in mice.Oncotarget. 2024 Aug 14;15:575-587. doi: 10.18632/oncotarget.28638. Oncotarget. 2024. PMID: 39145534 Free PMC article.
-
The a3 isoform of subunit a of the vacuolar ATPase localizes to the plasma membrane of invasive breast tumor cells and is overexpressed in human breast cancer.Oncotarget. 2016 Jul 19;7(29):46142-46157. doi: 10.18632/oncotarget.10063. Oncotarget. 2016. PMID: 27323815 Free PMC article.
-
Regulation of V-ATPase Assembly in Nutrient Sensing and Function of V-ATPases in Breast Cancer Metastasis.Front Physiol. 2018 Jul 13;9:902. doi: 10.3389/fphys.2018.00902. eCollection 2018. Front Physiol. 2018. PMID: 30057555 Free PMC article. Review.
References
-
- Nguyen D. X., Bos P. D., Massagué J. (2009) Metastasis. From dissemination to organ-specific colonization. Nat. Rev. Cancer 9, 274–284 - PubMed
-
- Spano D., Zollo M. (2012) Tumor microenvironment. A main actor in the metastasis process. Clin. Exp. Metastasis 29, 381–395 - PubMed
-
- Gupta G. P., Massagué J. (2006) Cancer metastasis. Building a framework. Cell 127, 679–695 - PubMed
-
- Martínez-Zaguilán R., Seftor E. A., Seftor R. E., Chu Y. W., Gillies R. J., Hendrix M. J. (1996) Acidic pH enhances the invasive behavior of human melanoma cells. Clin. Exp. Metastasis 14, 176–186 - PubMed
Publication types
MeSH terms
Substances
Grants and funding
LinkOut - more resources
Full Text Sources
Other Literature Sources
Medical
