

The ins and outs of the BCCAo model for chronic hypoperfusion: a multimodal and longitudinal MRI approach
- PMID: 24058609
- PMCID: PMC3776744
- DOI: 10.1371/journal.pone.0074631
The ins and outs of the BCCAo model for chronic hypoperfusion: a multimodal and longitudinal MRI approach
Abstract
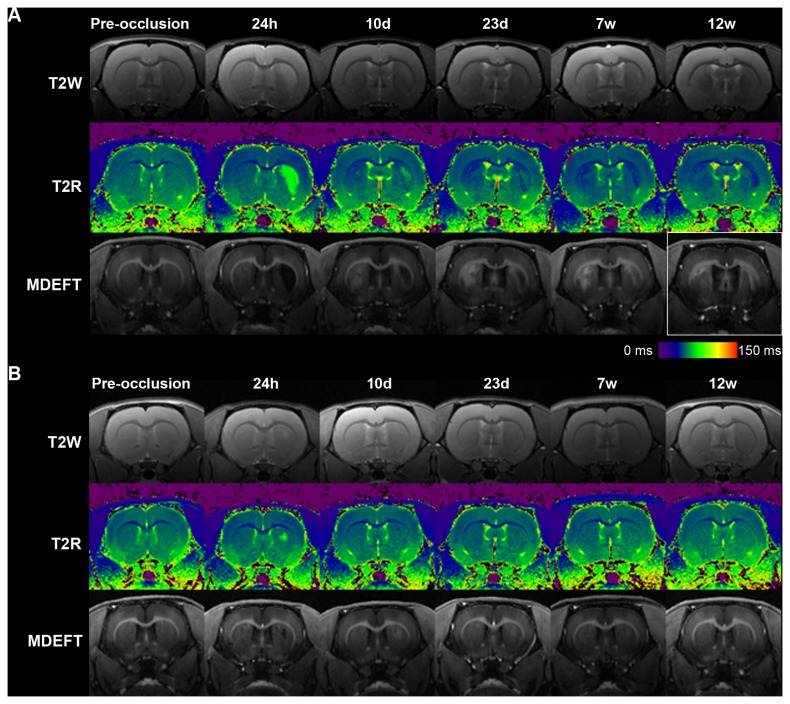
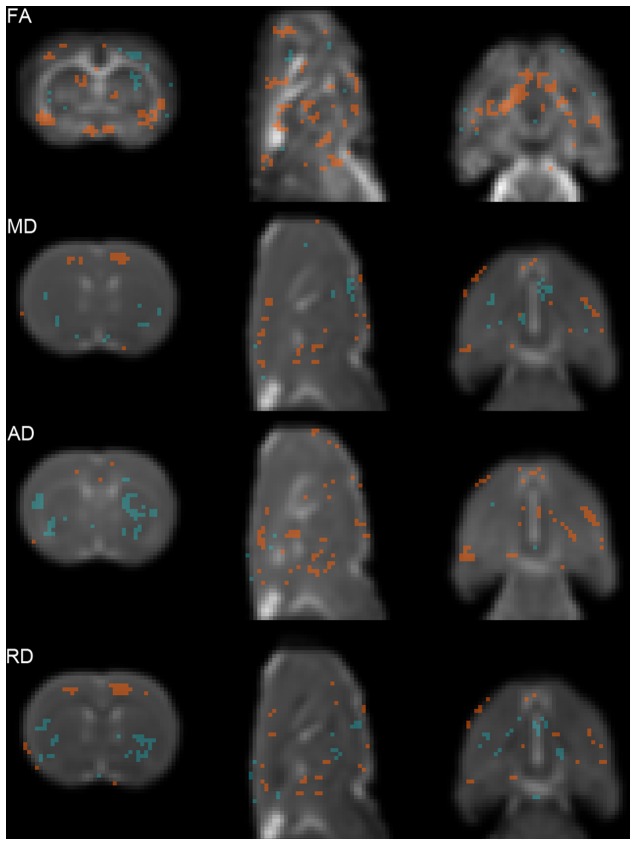
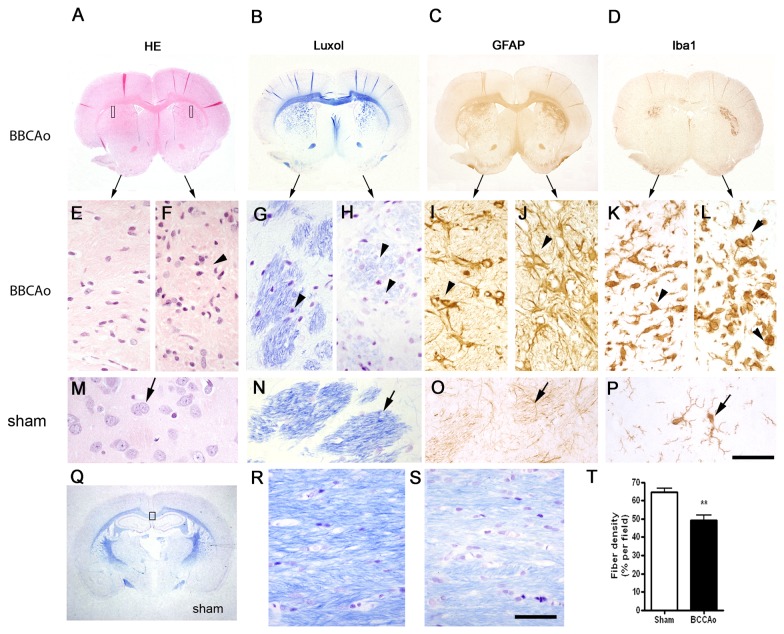
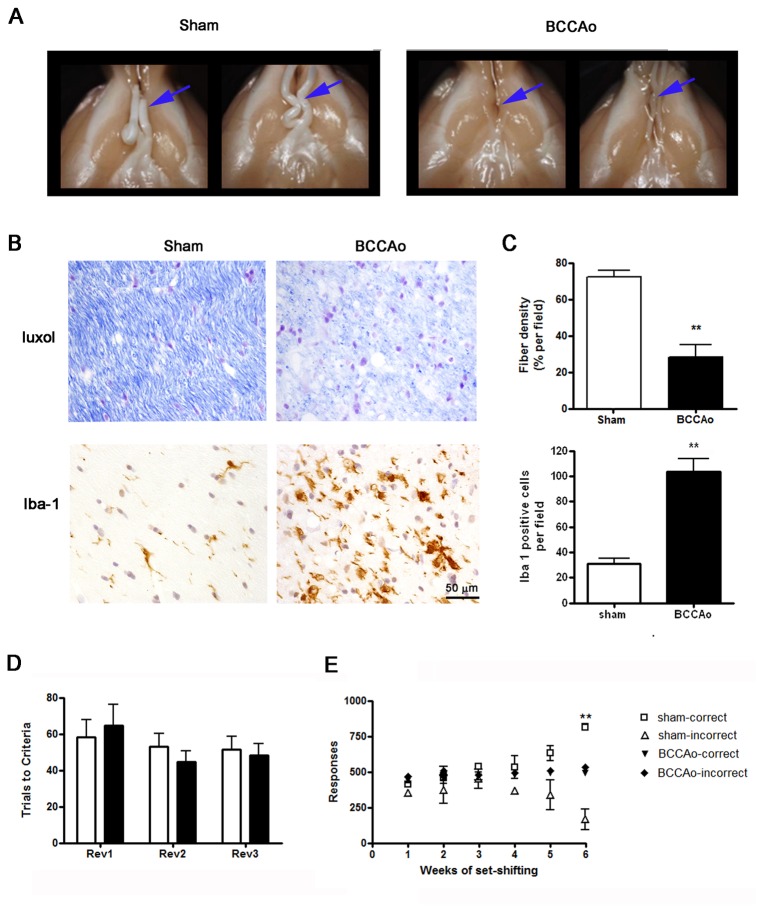
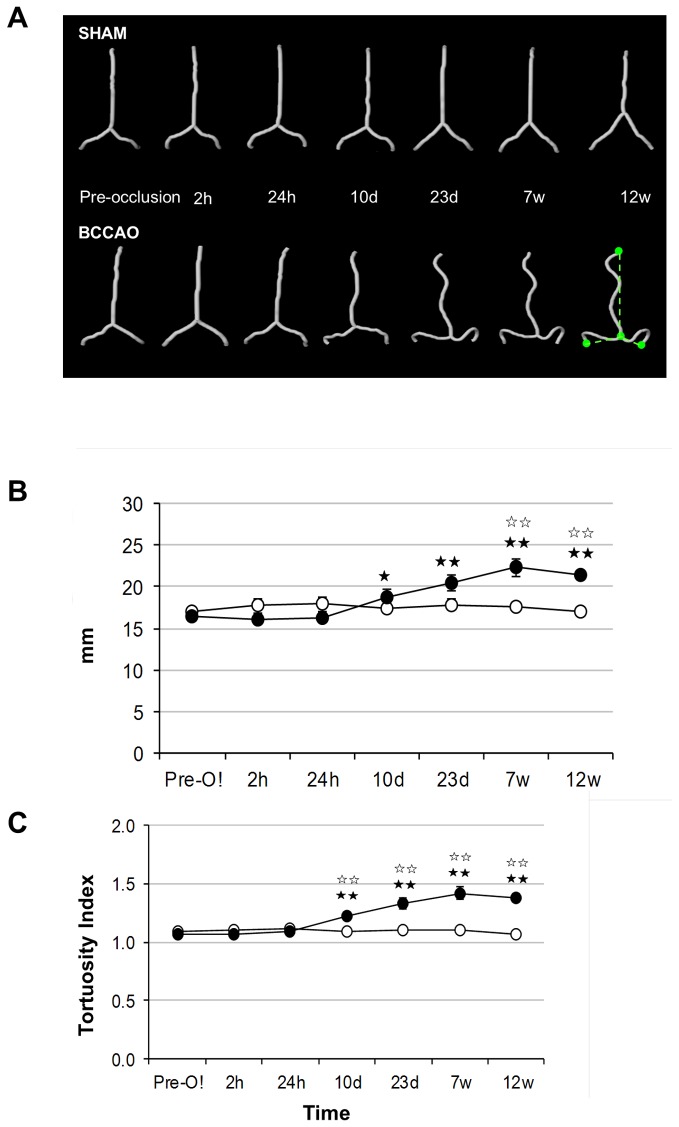
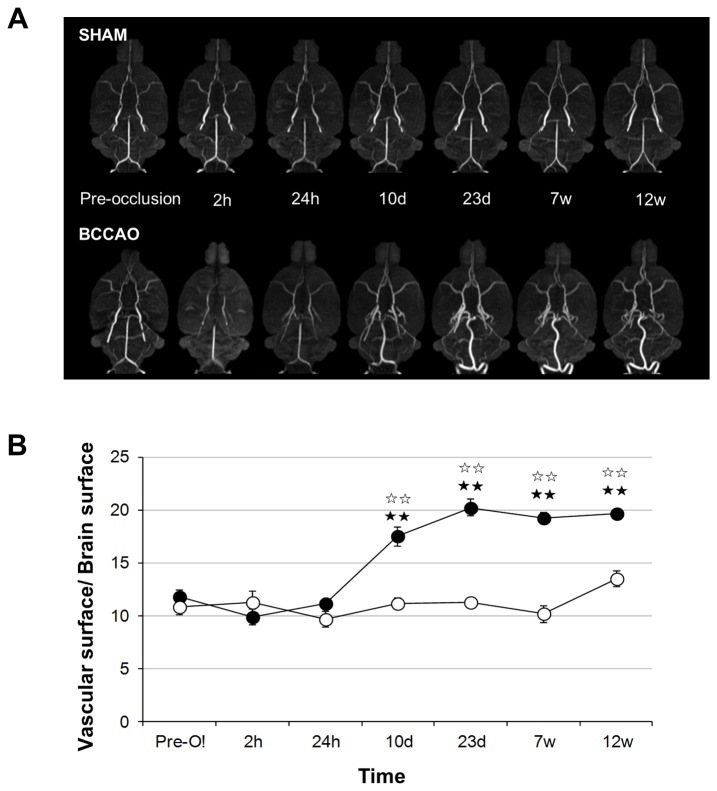
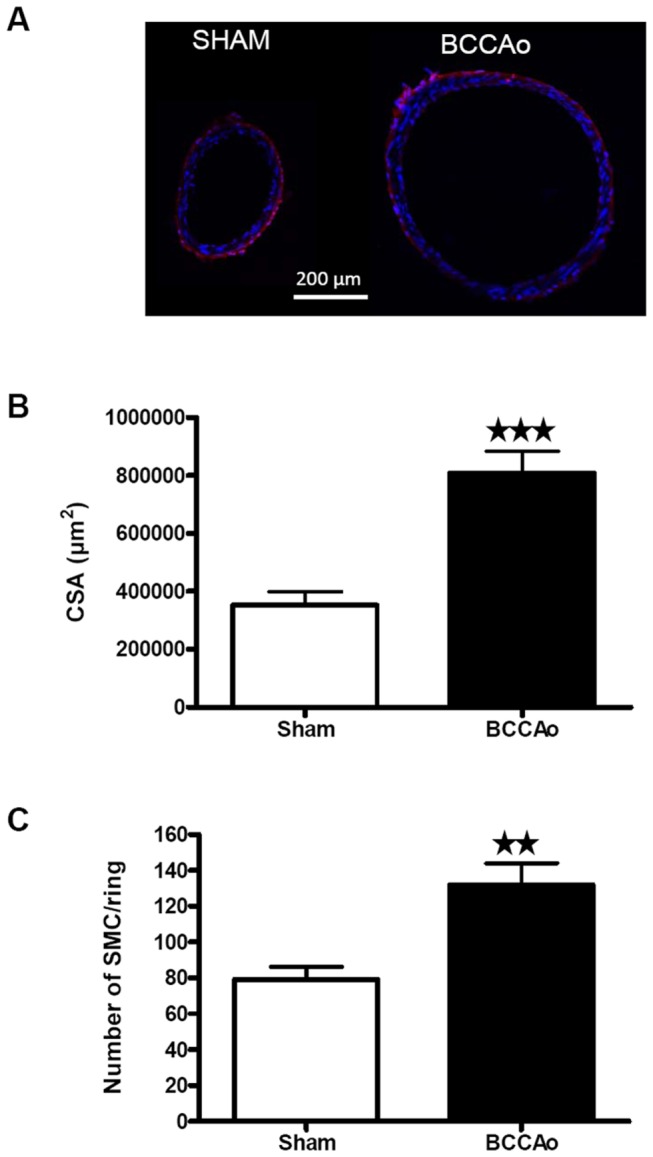
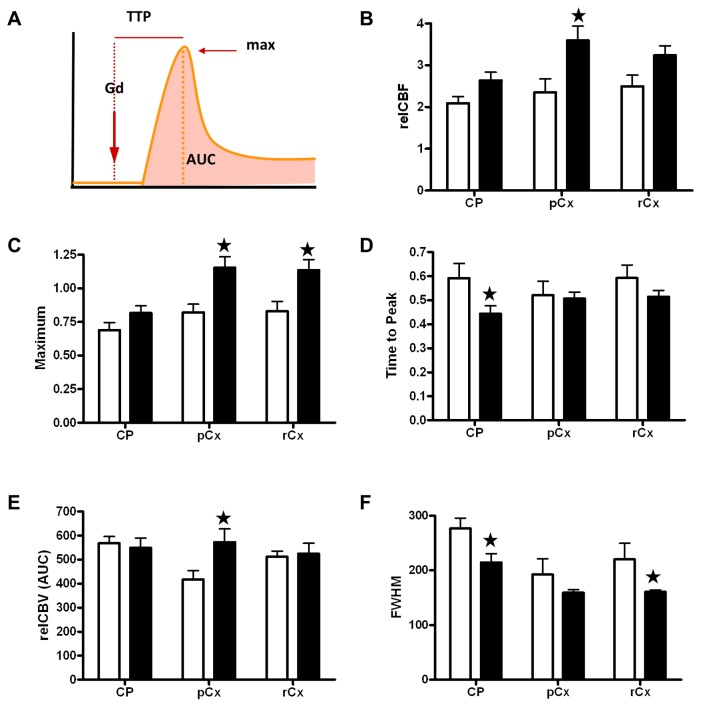
Cerebral hypoperfusion induced by bilateral common carotid artery occlusion (BCCAo) in rodents has been proposed as an experimental model of white matter damage and vascular dementia. However, the histopathological and behavioral alterations reported in this model are variable and a full characterization of the dynamic alterations is not available. Here we implemented a longitudinal multimodal magnetic resonance imaging (MRI) design, including time-of-flight angiography, high resolution T1-weighted images, T2 relaxometry mapping, diffusion tensor imaging, and cerebral blood flow measurements up to 12 weeks after BCCAo or sham-operation in Wistar rats. Changes in MRI were related to behavioral performance in executive function tasks and histopathological alterations in the same animals. MRI frequently (70%) showed various degrees of acute ischemic lesions, ranging from very small to large subcortical infarctions. Independently, delayed MRI changes were also apparent. The patterns of MRI alterations were related to either ischemic necrosis or gliosis. Progressive microstructural changes revealed by diffusion tensor imaging in white matter were confirmed by observation of myelinated fiber degeneration, including severe optic tract degeneration. The latter interfered with the visually cued learning paradigms used to test executive functions. Independently of brain damage, BCCAo induced progressive arteriogenesis in the vertebrobasilar tree, a process that was associated with blood flow recovery after 12 weeks. The structural alterations found in the basilar artery were compatible with compensatory adaptive changes driven by shear stress. In summary, BCCAo in rats induces specific signatures in multimodal MRI that are compatible with various types of histological lesion and with marked adaptive arteriogenesis.
Conflict of interest statement
Figures
Similar articles
-
Bilateral common carotid artery occlusion induced brain lesions in rats: A longitudinal diffusion tensor imaging study.Magn Reson Imaging. 2015 Jun;33(5):551-8. doi: 10.1016/j.mri.2015.02.010. Epub 2015 Feb 21. Magn Reson Imaging. 2015. PMID: 25708261
-
Stepwise occlusion of the carotid arteries of the rat: MRI assessment of the effect of donepezil and hypoperfusion-induced brain atrophy and white matter microstructural changes.PLoS One. 2018 May 31;13(5):e0198265. doi: 10.1371/journal.pone.0198265. eCollection 2018. PLoS One. 2018. PMID: 29851990 Free PMC article.
-
Astrocytes react to oligemia in the forebrain induced by chronic bilateral common carotid artery occlusion in rats.Brain Res. 2005 Aug 2;1052(1):28-39. doi: 10.1016/j.brainres.2005.06.018. Brain Res. 2005. PMID: 16023090
-
[Differences of brain pathological changes and cognitive function after bilateral common carotid artery occlusion between Sprague-Dawley and Wistar rats].Sheng Li Xue Bao. 2019 Oct 25;71(5):705-716. Sheng Li Xue Bao. 2019. PMID: 31646324 Chinese.
-
Hemodynamic changes and neuronal damage detected by 9.4 T MRI in rats with chronic cerebral ischemia and cognitive impairment.Brain Behav. 2022 Jul;12(7):e2642. doi: 10.1002/brb3.2642. Epub 2022 Jun 10. Brain Behav. 2022. PMID: 35687797 Free PMC article.
Cited by
-
Models and mechanisms of vascular dementia.Exp Neurol. 2015 Oct;272:97-108. doi: 10.1016/j.expneurol.2015.05.006. Epub 2015 May 15. Exp Neurol. 2015. PMID: 25987538 Free PMC article. Review.
-
Chronic cerebral hypoperfusion and plasticity of the posterior cerebral artery following permanent bilateral common carotid artery occlusion.Korean J Physiol Pharmacol. 2017 Nov;21(6):643-650. doi: 10.4196/kjpp.2017.21.6.643. Epub 2017 Oct 30. Korean J Physiol Pharmacol. 2017. PMID: 29200907 Free PMC article.
-
Carotid artery vascular stenosis causes the blood-CSF barrier damage and neuroinflammation.J Neuroinflammation. 2024 Sep 10;21(1):220. doi: 10.1186/s12974-024-03209-1. J Neuroinflammation. 2024. PMID: 39256783 Free PMC article.
-
The effect of Scutellaria baicalensis stem-leaf flavonoids on spatial learning and memory in chronic cerebral ischemia-induced vascular dementia of rats.Acta Biochim Biophys Sin (Shanghai). 2016 May;48(5):437-46. doi: 10.1093/abbs/gmw024. Acta Biochim Biophys Sin (Shanghai). 2016. PMID: 27118553 Free PMC article.
-
Neuroprotective Effects of Theobromine in permanent bilateral common carotid artery occlusion rat model of cerebral hypoperfusion.Metab Brain Dis. 2022 Aug;37(6):1787-1801. doi: 10.1007/s11011-022-00995-6. Epub 2022 May 19. Metab Brain Dis. 2022. PMID: 35587851
References
-
- Kalaria RN, Akinyemi R, Ihara M (2012) Does vascular pathology contribute to Alzheimer changes? J Neurol Sci 322: 141-147. doi:10.1016/j.jns.2012.07.032. PubMed: 22884479. - DOI - PubMed
-
- Moorhouse P, Rockwood K (2008) Vascular cognitive impairment: current concepts and clinical developments. Lancet Neurol 7: 246-255. doi:10.1016/S1474-4422(08)70040-1. PubMed: 18275926. - DOI - PubMed
-
- Hainsworth AH, Brittain JF, Khatun H (2012) Pre-clinical models of human cerebral small vessel disease: Utility for clinical application. J Neurol Sci 322: 237-240. doi:10.1016/j.jns.2012.05.046. PubMed: 22698483. - DOI - PubMed
-
- Okamoto Y, Yamamoto T, Kalaria RN, Senzaki H, Maki T et al. (2012) Cerebral hypoperfusion accelerates cerebral amyloid angiopathy and promotes cortical microinfarcts. Acta Neuropathol 123: 381-394. doi:10.1007/s00401-011-0925-9. PubMed: 22170742. - DOI - PMC - PubMed
-
- Pimentel-Coelho PM, Michaud JP, Rivest S (2013) Effects of mild chronic cerebral hypoperfusion and early amyloid pathology on spatial learning and the cellular innate immune response in mice. Neurobiol Aging 34: 679-693. doi:10.1016/j.neurobiolaging.2012.06.025. PubMed: 22819135. - DOI - PubMed
Publication types
MeSH terms
Substances
Grants and funding
LinkOut - more resources
Full Text Sources
Other Literature Sources
Medical
