Review
. 2013 Oct;38(10):515-30.
doi: 10.1016/j.tibs.2013.08.003. Epub 2013 Sep 19.

Structure, dynamics and biophysics of the cytoplasmic protein-protein complexes of the bacterial phosphoenolpyruvate: sugar phosphotransferase system

Affiliations
Review

Structure, dynamics and biophysics of the cytoplasmic protein-protein complexes of the bacterial phosphoenolpyruvate: sugar phosphotransferase system

G Marius Clore et al. Trends Biochem Sci. 2013 Oct.

Abstract

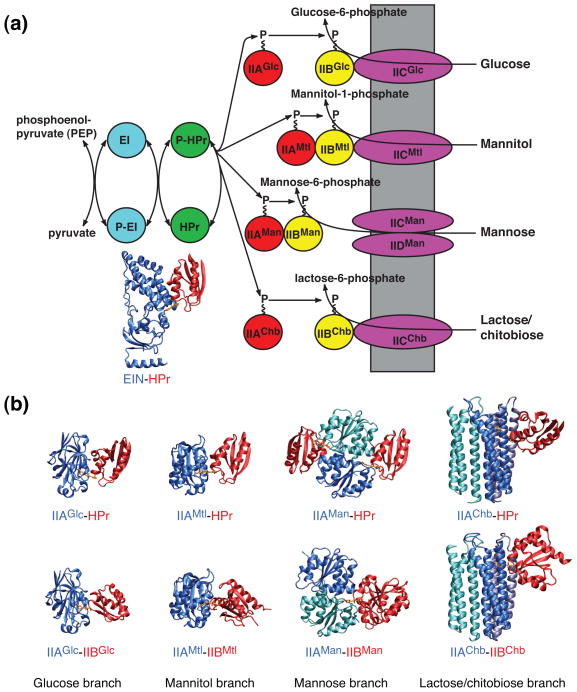
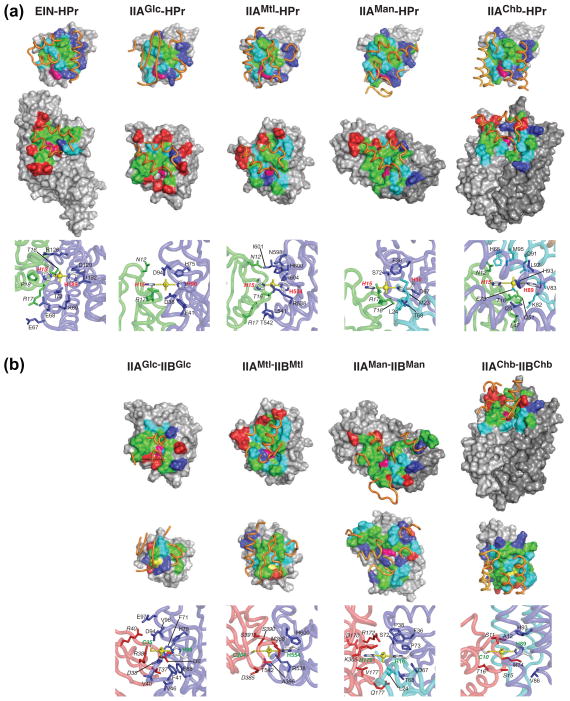
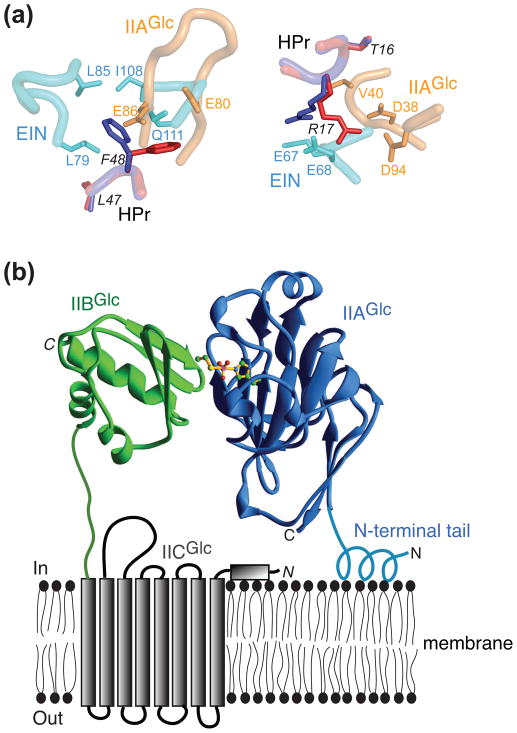
The bacterial phosphotransferase system (PTS) couples phosphoryl transfer, via a series of bimolecular protein-protein interactions, to sugar transport across the membrane. The multitude of complexes in the PTS provides a paradigm for studying protein interactions, and for understanding how the same binding surface can specifically recognize a diverse array of targets. Fifteen years of work aimed at solving the solution structures of all soluble protein-protein complexes of the PTS has served as a test bed for developing NMR and integrated hybrid approaches to study larger complexes in solution and to probe transient, spectroscopically invisible states, including encounter complexes. We review these approaches, highlighting the problems that can be tackled with these methods, and summarize the current findings on protein interactions.

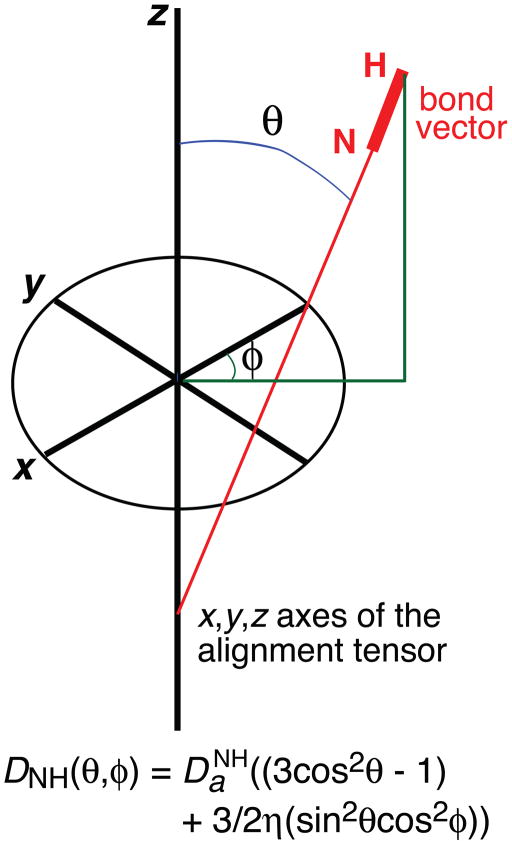
Keywords: NMR spectroscopy; bacterial phosphotransferase system; encounter complexes; hybrid methods in structure determination; protein–protein recognition; residual dipolar couplings; signal transduction; solution X-ray scattering; sparsely populated states.


Figures

Box 1 figure
Box 1 figure
Fig. 1
Fig. 1
Summary of the PTS signal transduction pathway. (a) The first two steps are common to all branches of the pathway. Thereafter the pathway splits into four sugar-specific classes: glucose, mannitol, mannose and lactose/chitobiose. (b) Ribbon diagrams of the structures of the nine cytoplasmic complexes of the E. coli PTS. EIN-HPr [42] (shown in panel A); IIAGlc-HPr [47]; IIAMtl-HPr [45]; IIAMan-HPr[48]; IIAChb-HPr [49]; IIAGlc-IIBGlc [19]; IIAMtl-IIBMtl [50]; IIAMan-IIBMan [20]; IIAChb-IIBChb [51].
Fig. 2
Fig. 2
Summary of interaction surfaces for the cytoplasmic complexes of the PTS. Complexes of (a) EIN and the four classes of enzymes IIA with HPr and of (b) the four classes of Enzymes IIA with their respective Enzyme IIB counterparts. (a) Top row, interaction surfaces on HPr; middle row, interaction surfaces on EIN and Enzymes IIA; bottom row, close up of the phoshoryl transition states. (b) Top row, interaction surfaces on Enzymes IIA; middle row, interaction surfaces on Enzymes IIB; bottom row, close up of the phoshoryl transition states. For both panels (a) and (b) residues on the interaction surfaces (top and middle rows) are color-coded as hydrophobic (green), hydrophilic (cyan), positively charged (blue), negatively charged (red), active site histidine (purple) and active site cysteine (yellow). Also shown in the top and middle rows are the relevant portions of the backbone of the interacting partner displayed as gold tubes. In the bottom row of panel (a), HPr is displayed in green, EIN and Enzymes IIA in blue, and the pentacoordinate phosphoryl group in yellow; residues labels for HPr are in italic. In the bottom row of panel (b), Enzymes IIB are displayed in red, Enzymes IIA in blue, and the pentacoordinate phosphoryl group in yellow; residues labels for Enzymes IIB are in italic. EIN-HPr [42]; IIAGlc-HPr [47]; IIAMtl-HPr [45]; IIAMan-HPr[48]; IIAChb-HPr [49]; IIAGlc-IIBGlc [19]; IIAMtl-IIBMtl [50]; IIAMan-IIBMan [20]; IIAChb-IIBChb [51].
Fig. 3
Fig. 3
Role of conformational side chain plasticity and membrane anchoring tails in protein complexes of the PTS. (a) Conformational side chain plasticity illustrated by complexes of HPr with EIN and IIAGlc. EIN is shown in cyan, IIAGlc in orange, HPr in the EIN-HPr complex in blue, and HPr in the IIAGlc-HPr complex in red. Residues of HPr are labeled in italics. Alternate conformations for Phe48 and Arg17 of HPr are illustrated in the left and right panels, respectively. Adapted from [47]. (b) Role of the N-terminal tail of IIAGlc in facilitating phosphotransfer to IIBCGlc. IIAGlc is shown in blue and residues 2–10 adopt a helical conformation upon interaction with the lipid bilayer of the bacterial cell membrane, thereby stabilizing the IIAGlc-IIBCGlc complex by partially anchoring IIAGlc to the lipid membrane. IIBGlc is shown in green, and a cartoon of the transmembrane IICGlc domain which includes eight transmembrane helices is shown in grey. Adapted from [19].
Fig. 4
Fig. 4
Comparison of open and closed states of EI. (a) The open state is found in the isolated EIN domain (left panel) and in intact EI both free and in complex with HPr [, –42]; the closed state (middle panel) is found in the crystal structure of the trapped phosphorylated intermediate of EI [33]. The EINα/β subdomain (cyan) is shown in the same orientation in both panels. Only a single subunit of phosphorylated EI is shown. The color coding is as follows: EINα, blue; EINα/β, cyan; EIC, red; linker connecting EINα/β to EIC, brown; HPr, purple. HPr bound to the EINα subdomain of phosphorylated EI (closed state) in the same orientation as in the EIN-HPr complex (open state) is shown in the middle panel as a transparent purple ribbon to illustrate that the HPr binding site is available in the closed state and there are no clashes between HPr and EIC in this conformation, but that the distance between His15 of HPr and His189 of EINα is much too large (~30 Å) to allow phosphoryl transfer from EIN to HPr to take place in the closed state. The right panel shows a model of in-line phosphoryl transfer from PEP to His189 in the closed state. (b) Comparison of the crystal structure of the trapped phosphorylated intermediate of the EI dimer (closed state) with the solution structures of the free EI dimer and the dimeric EI-HPr complex (open state) determined from combined use of NMR residual dipolar couplings and solution X-ray scattering (SAXS/WAXS). The color coding is the same as in (a).
Fig. 5
Fig. 5
Catalytic cycle of EI. Only a single subunit is displayed for clarity with the molecular surfaces of the EINα and EINα/β subdomains of EIN in green and blue, respectively, the molecular surface of EIC domain in red, the linker connecting EINα/β to EIC in a gold ribbon, and HPr in a purple ribbon. Structures I and V correspond to free EI and the EI-HPr complex (open state) solved by NMR and SAXS/WAXS, structure II to the crystal structure of the trapped phosphorylated intermediate (closed state), and structures III, IV and IV′ (shown in brackets) to postulated intermediates. Structure III corresponds to the binding of HPr to the trapped phosphorylated intermediate; structures IV and IV′ correspond to structures in which the orientation of the EINα/β subdomain relative to EIC is the same as that in free EI (I) or the EI-HPr complex (V), while the orientation of the EINα subdomain relative to EINα/β is the same as that in the trapped phosphorylated intermediate (II). The EIC domain (red) is displayed in the same orientation for all structures. Adapted from [40].
Fig. 6
Fig. 6
Structure and dynamics of the isolated EIC dimer. (a) Structural model of the E. coli EIC-PEP complex derived from the crystal structures of the T. tengcongensis EIC-PEP complex [68] and the E. coli phosphorylated EI intermediate [33]. One subunit is in grey, the other in yellow. PEP is in green; the side chains of Lys340, Arg358 and Arg 465 in red; and backbone nitrogen atoms exhibiting significant relaxation dispersion, characteristic of motion on the submillisecond to millisecond time scale, in blue. The inset shows a close-up of the β3α3 turn. (b) Close-up view of the EIC dimer interface. (c) Superposition of the crystal structures of EIC [–35] [67, 68], illustrating the conformational variability of the β3α3 turn, with the closed conformation of the β3α3 turn seen in the crystal structure of the trapped phosphorylated EI intermediate in red. (D) The overall exchange rate between major (97%) and minor (3%) species determined by 15N-NMR relaxation dispersion spectroscopy is ~1550 s−1. The 15N chemical shift differences between the major and minor species determined from relaxation dispersion on free EIC correspond closely to the differences in chemical shifts between free EIC and EIC complexed to PEP, strongly suggesting that the minor species represents the closed conformation of the β3α3 turn. Adapted from [71].
Fig. 7
Fig. 7
Characterization of transient sparsely-populated encounter complexes for the interaction of EIN and HPr. (a) Comparison of experimental backbone amide intermolecular PREs (1HN2) (circles) observed on 15N-labeled EIN and arising from covalently attached paramagnetic tags (EDTA-Mn2+) located at two positions on HPr (E5C and E32C) with the PRE profiles calculated from the structure of the specific complex (black line). Black and purple circles indicate PREs attributable to the specific complex and to an ensemble of encounter complexes, respectively. (b) Intermolecular PREs as a function of added paramagnetically-labeled HPr(E5C) illustrating three types of titration behavior. (c) Mapping of intermolecular PREs attributable to the specific complex (black) and to the encounter complexes (class I, blue; class II, red; mixture of classes I and II, purple; and encounter complex PREs that are too large to measure accurately, pink). (d) Equilibrium binding model for the EIN/HPr association pathway. Adapted from [79]
Fig. 8
Fig. 8
Productive, phosphoryl transfer competent (left) and non-productive, phopshoryl transfer incompetent (right) complexes of IIAMan and IIBMan. Both productive and non-productive complexes are significantly populated in the absence of phosphorylation or mutation of His10 of IIAMan to Glu to mimic the phosphorylated state. The latter mutation shifts the equilibrium almost entirely to the productive complex. The two subunits of IIAMan are shown in blue and red, respectively, and IIBMan is in green. Only a single IIBMan molecule is shown for clarity. Adapted from [20].

Similar articles

Cited by

References

    1. Kundig W, Ghosh S, Roseman S. Phosphate bound to histidine in a protein as an intermediate in a novel phospho-transferase system. Proc Natl Acad Sci U S A. 1964;52:1067–1074. - PMC - PubMed
    1. Meadow ND, Fox DK, Roseman S. The bacterial phosphoenolpyruvate: glycose phosphotransferase system. Ann Rev Biochem. 1990;59:497–542. - PubMed
    1. Postma PW, Lengeler JW, Jacobson GR. Phosphoenolpyruvate: carbohydrate phosphotransferase systems of bacteria. Microbiol Rev. 1993;57:543–594. - PMC - PubMed
    1. Herzberg O, Klevit R. Unraveling a bacterial hexose transport pathway. Cuur Op Struct Biol. 1994;4:814–822. - PubMed
    1. Robillard GT, Broos J. Structure/function studies on the bacterial carbohydrate transporters, enzymes II, of the phosphoenolpyruvate-dependent phosphotransferase system. Biochim Biophys Acta. 1999;1422:73–104. - PubMed

Publication types

MeSH terms

Substances

LinkOut - more resources