Concomitant targeting of multiple key transcription factors effectively disrupts cancer stem cells enriched in side population of human pancreatic cancer cells
- PMID: 24040121
- PMCID: PMC3770686
- DOI: 10.1371/journal.pone.0073942
Concomitant targeting of multiple key transcription factors effectively disrupts cancer stem cells enriched in side population of human pancreatic cancer cells
Expression of concern in
-
Expression of Concern: Concomitant Targeting of Multiple Key Transcription Factors Effectively Disrupts Cancer Stem Cells Enriched in Side Population of Human Pancreatic Cancer Cells.PLoS One. 2017 Mar 14;12(3):e0174194. doi: 10.1371/journal.pone.0174194. eCollection 2017. PLoS One. 2017. PMID: 28291824 Free PMC article. No abstract available.
Abstract
Background: A major challenge in the treatment of pancreatic ductal adenocarcinoma is the failure of chemotherapy, which is likely due to the presence of the cancer stem cells (CSCs).
Objective: To identify side population (SP) cells and characterize s-like properties in human pancreatic cancer cell lines (h-PCCLs) and to exploit the efficacy of concomitant targeting of multiple key transcription factors governing the stemness of pancreatic CSCs in suppressing CSC-like phenotypes.
Methods: Flow cytometry and Hoechst 33342 DNA-binding dye efflux assay were used to sort SP and non-SP (NSP) cells from three h-PCCLs: PANC-1, SW1990, and BxPc-3. The self-renewal ability, invasiveness, migration and drug resistance of SP cells were evaluated. Expression of CSC marker genes was analyzed. Tumorigenicity was assessed using a xenograft model in nude mice. Effects of a complex decoy oligonucleotide (cdODN-SCO) designed to simultaneously targeting Sox2, Oct4 and c-Myc were assessed.
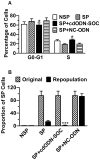
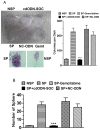
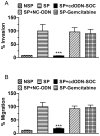
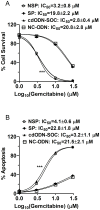
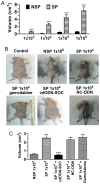
Results: CSCs were enriched in the side proportion (SP) cells contained in the h-PCCLs and they possessed aggressive growth, invasion, migration and drug-resistance properties, compared with NSP cells. SP cells overexpressed stem cell markers CD133 and ALDH1, pluripotency maintaining factors Nanog, Sox2 and Oct4, oncogenic transcription factor c-Myc, signaling molecule Notch1, and drug resistant gene ABCG2. Moreover, SP cells consistently demonstrated significantly greater tumorigenicity than NSP cells in xenograft model of nude mice. CdODN-SOC efficiently suppressed all CSC properties and phenotypes, and minimized the tumorigenic capability of the SP cells and the resistance to chemotherapy. By comparison, the negative control failed to do so.
Conclusion: The findings indicate that targeting the key genes conferring the stemness of CSCs can efficiently eliminate CSC-like phenotypes, and thus may be considered a new approach for cancer therapy. Specifically, the present study establishes the combination of Sox2/Oct4/c-Myc targeting as a potential anti-pancreatic cancer agent worthy of further studies in preclinical settings.
Conflict of interest statement
Figures
Similar articles
-
Side population cells of pancreatic cancer show characteristics of cancer stem cells responsible for resistance and metastasis.Target Oncol. 2015 Jun;10(2):215-27. doi: 10.1007/s11523-014-0323-z. Epub 2014 Jun 22. Target Oncol. 2015. PMID: 24950733
-
RNA Polymerase II-Associated Factor 1 Regulates Stem Cell Features of Pancreatic Cancer Cells, Independently of the PAF1 Complex, via Interactions With PHF5A and DDX3.Gastroenterology. 2020 Nov;159(5):1898-1915.e6. doi: 10.1053/j.gastro.2020.07.053. Epub 2020 Aug 8. Gastroenterology. 2020. PMID: 32781084 Free PMC article.
-
[Analysis of the characteristics of side population cells in the human ovarian cancer cell line OVCAR-3].Zhonghua Fu Chan Ke Za Zhi. 2012 Apr;47(4):281-5. Zhonghua Fu Chan Ke Za Zhi. 2012. PMID: 22781115 Chinese.
-
Embryonic stem cell factors and pancreatic cancer.World J Gastroenterol. 2014 Mar 7;20(9):2247-54. doi: 10.3748/wjg.v20.i9.2247. World J Gastroenterol. 2014. PMID: 24605024 Free PMC article. Review.
-
Markers of pancreatic cancer stem cells and their clinical and therapeutic implications.Mol Biol Rep. 2019 Dec;46(6):6629-6645. doi: 10.1007/s11033-019-05058-1. Epub 2019 Sep 5. Mol Biol Rep. 2019. PMID: 31486978 Review.
Cited by
-
Quantitative profiling of chromatome dynamics reveals a novel role for HP1BP3 in hypoxia-induced oncogenesis.Mol Cell Proteomics. 2014 Dec;13(12):3236-49. doi: 10.1074/mcp.M114.038232. Epub 2014 Aug 6. Mol Cell Proteomics. 2014. PMID: 25100860 Free PMC article.
-
Abnormal alterations of miR-1 and miR-214 are associated with clinicopathological features and prognosis of patients with PDAC.Oncol Lett. 2017 Oct;14(4):4605-4612. doi: 10.3892/ol.2017.6819. Epub 2017 Aug 24. Oncol Lett. 2017. PMID: 29085459 Free PMC article.
-
Altered Membrane Expression and Function of CD11b Play a Role in the Immunosuppressive Effects of Morphine on Macrophages at the Nanomolar Level.Pharmaceuticals (Basel). 2023 Feb 13;16(2):282. doi: 10.3390/ph16020282. Pharmaceuticals (Basel). 2023. PMID: 37259426 Free PMC article.
-
Identification, characterization and microRNA expression profiling of side population cells in human oral squamous cell carcinoma Tca8113 cell lines.Mol Med Rep. 2020 Jul;22(1):286-296. doi: 10.3892/mmr.2020.11073. Epub 2020 Apr 16. Mol Med Rep. 2020. PMID: 32319646 Free PMC article.
-
Indirect Mechanisms of Transcription Factor-Mediated Gene Regulation during Cell Fate Changes.Adv Genet (Hoboken). 2022 Nov 9;3(4):2200015. doi: 10.1002/ggn2.202200015. eCollection 2022 Dec. Adv Genet (Hoboken). 2022. PMID: 36911290 Free PMC article.
References
-
- Hidalgo M, Von Hoff DD (2012) Translational therapeutic opportunities in ductal adenocarcinoma of the pancreas. Clin Cancer Res 18: 4249–4256. doi:10.1158/1078-0432.CCR-12-1327. PubMed: 22896691. - DOI - PubMed
-
- Sergeant G, Vankelecom H, Gremeaux L, Topal B (2009) Role of cancer stem cells in pancreatic ductal adenocarcinoma. Nat Rev Clin Oncol 6: 580–586. doi:10.1038/nrclinonc.2009.127. PubMed: 19687789. - DOI - PubMed
-
- Reya T, Morrison SJ, Clarke MF, Weissman IL (2001) Stem cells, cancer, and cancer stem cells. Nature 414: 105–111. doi:10.1038/35102167. PubMed: 11689955. - DOI - PubMed
-
- Rasheed ZA, Matsui W (2012) Biological and clinical relevance of stem cells in pancreatic adenocarcinoma. J Gastroenterol Hepatol 27 Suppl 2: 15–18. doi:10.1111/j.1440-1746.2011.07015.x. PubMed: 22320910. - DOI - PMC - PubMed
-
- Balic A, Dorado J, Alonso-Gómez M, Heeschen C (2012) Stem cells as the root of pancreatic ductal adenocarcinoma. Exp Cell Res 318: 691–704. doi:10.1016/j.yexcr.2011.11.007. PubMed: 22119145. - DOI - PubMed
MeSH terms
Substances
Grants and funding
LinkOut - more resources
Full Text Sources
Other Literature Sources
Medical
Research Materials
Miscellaneous

