

Transcriptome and genome sequencing uncovers functional variation in humans
- PMID: 24037378
- PMCID: PMC3918453
- DOI: 10.1038/nature12531
Transcriptome and genome sequencing uncovers functional variation in humans
Abstract
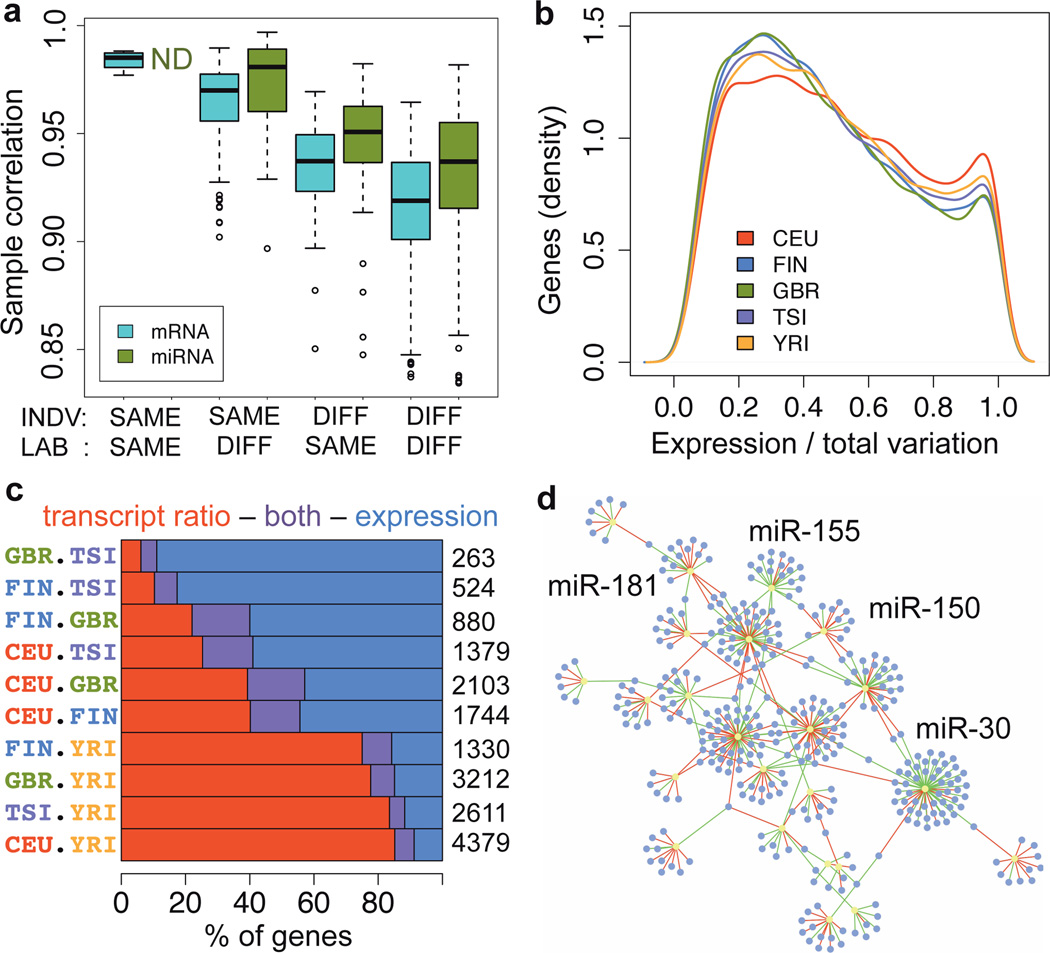
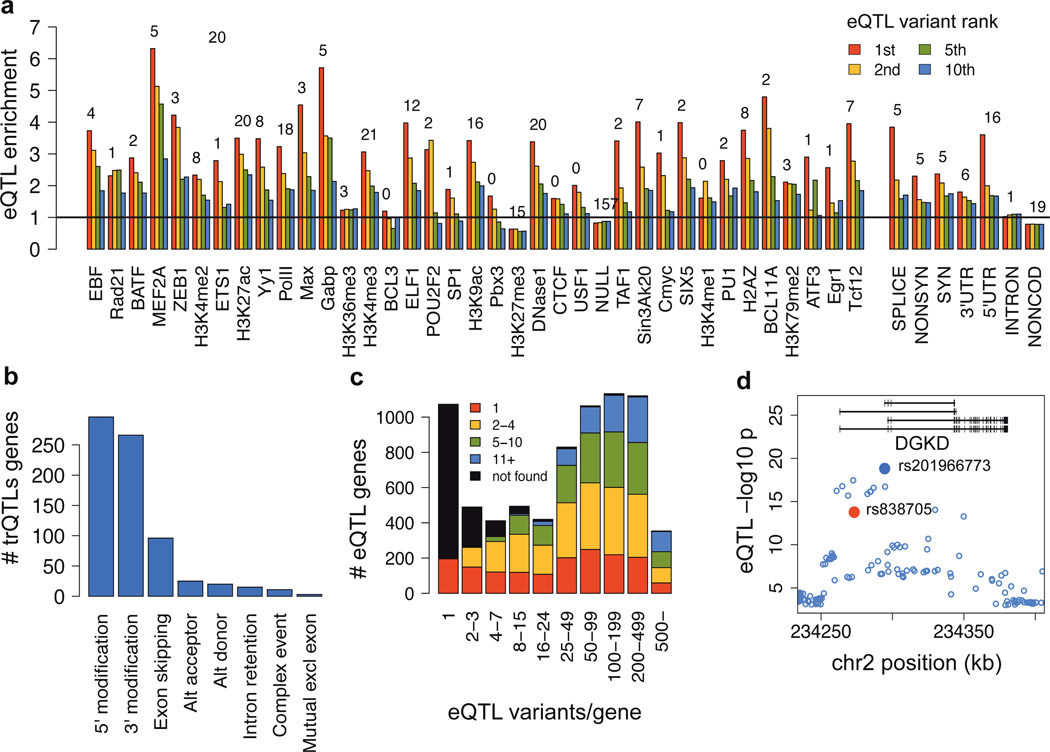
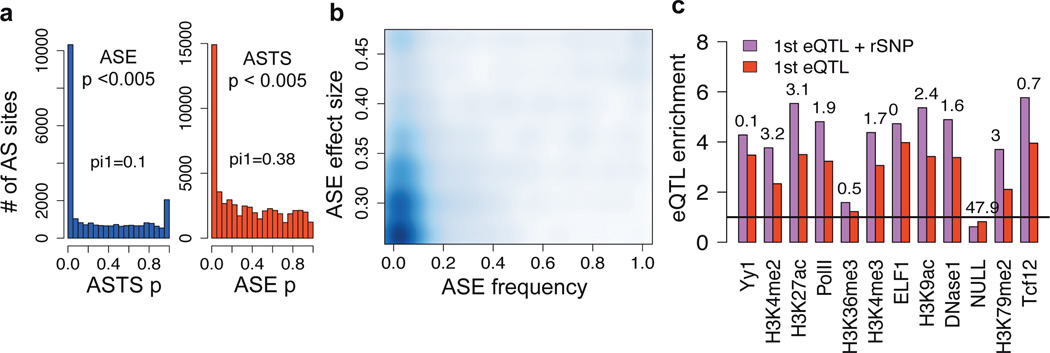
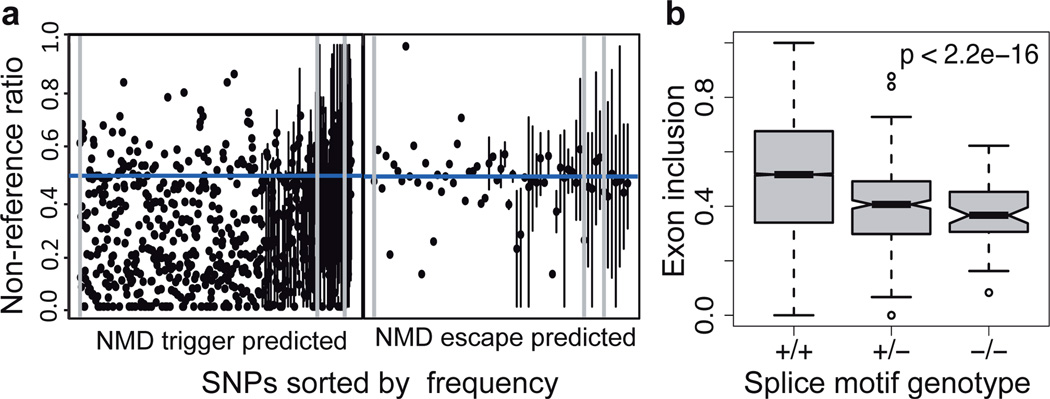
Genome sequencing projects are discovering millions of genetic variants in humans, and interpretation of their functional effects is essential for understanding the genetic basis of variation in human traits. Here we report sequencing and deep analysis of messenger RNA and microRNA from lymphoblastoid cell lines of 462 individuals from the 1000 Genomes Project--the first uniformly processed high-throughput RNA-sequencing data from multiple human populations with high-quality genome sequences. We discover extremely widespread genetic variation affecting the regulation of most genes, with transcript structure and expression level variation being equally common but genetically largely independent. Our characterization of causal regulatory variation sheds light on the cellular mechanisms of regulatory and loss-of-function variation, and allows us to infer putative causal variants for dozens of disease-associated loci. Altogether, this study provides a deep understanding of the cellular mechanisms of transcriptome variation and of the landscape of functional variants in the human genome.
Figures
Similar articles
-
Understanding mechanisms underlying human gene expression variation with RNA sequencing.Nature. 2010 Apr 1;464(7289):768-72. doi: 10.1038/nature08872. Epub 2010 Mar 10. Nature. 2010. PMID: 20220758 Free PMC article.
-
Rare and common regulatory variation in population-scale sequenced human genomes.PLoS Genet. 2011 Jul;7(7):e1002144. doi: 10.1371/journal.pgen.1002144. Epub 2011 Jul 21. PLoS Genet. 2011. PMID: 21811411 Free PMC article.
-
Identification of human genetic variants controlling circular RNA expression.RNA. 2019 Dec;25(12):1765-1778. doi: 10.1261/rna.071654.119. Epub 2019 Sep 13. RNA. 2019. PMID: 31519742 Free PMC article.
-
Genomic Analysis in the Age of Human Genome Sequencing.Cell. 2019 Mar 21;177(1):70-84. doi: 10.1016/j.cell.2019.02.032. Cell. 2019. PMID: 30901550 Free PMC article. Review.
-
Exome versus transcriptome sequencing in identifying coding region variants.Expert Rev Mol Diagn. 2012 Apr;12(3):241-51. doi: 10.1586/erm.12.10. Expert Rev Mol Diagn. 2012. PMID: 22468815 Review.
Cited by
-
Cross-population joint analysis of eQTLs: fine mapping and functional annotation.PLoS Genet. 2015 Apr 23;11(4):e1005176. doi: 10.1371/journal.pgen.1005176. eCollection 2015 Apr. PLoS Genet. 2015. PMID: 25906321 Free PMC article.
-
Partitioning and aggregating cross-tissue and tissue-specific genetic effects to identify gene-trait associations.Nat Commun. 2024 Jul 9;15(1):5769. doi: 10.1038/s41467-024-49924-4. Nat Commun. 2024. PMID: 38982044 Free PMC article.
-
Ornaments for efficient allele-specific expression estimation with bias correction.Am J Hum Genet. 2024 Aug 8;111(8):1770-1781. doi: 10.1016/j.ajhg.2024.06.014. Epub 2024 Jul 23. Am J Hum Genet. 2024. PMID: 39047729
-
Biased allelic expression in human primary fibroblast single cells.Am J Hum Genet. 2015 Jan 8;96(1):70-80. doi: 10.1016/j.ajhg.2014.12.001. Epub 2014 Dec 31. Am J Hum Genet. 2015. PMID: 25557783 Free PMC article.
-
Network regression analysis for binary and ordinal categorical phenotypes in transcriptome-wide association studies.Genetics. 2022 Nov 30;222(4):iyac153. doi: 10.1093/genetics/iyac153. Genetics. 2022. PMID: 36227056 Free PMC article.
References
-
- Emilsson V, et al. Genetics of gene expression and its effect on disease. Nature. 2008;452:423–428. doi:nature06758 [pii] 10.1038/nature06758. - PubMed
Publication types
MeSH terms
Substances
Grants and funding
- 098381/WT_/Wellcome Trust/United Kingdom
- 095552/WT_/Wellcome Trust/United Kingdom
- 083270/WT_/Wellcome Trust/United Kingdom
- 085475/B/08/Z/WT_/Wellcome Trust/United Kingdom
- MH090941/MH/NIMH NIH HHS/United States
- 075491/Z/04/B/WT_/Wellcome Trust/United Kingdom
- 090532/WT_/Wellcome Trust/United Kingdom
- 090532/Z/09/Z/WT_/Wellcome Trust/United Kingdom
- R01 MH090941/MH/NIMH NIH HHS/United States
- WT_/Wellcome Trust/United Kingdom
- R01 GM104371/GM/NIGMS NIH HHS/United States
- 085532/WT_/Wellcome Trust/United Kingdom
- 085475/Z/08/Z/WT_/Wellcome Trust/United Kingdom
- G0601261/MRC_/Medical Research Council/United Kingdom
- 090367/WT_/Wellcome Trust/United Kingdom
- 095552/Z/11/Z/WT_/Wellcome Trust/United Kingdom
- 081917/WT_/Wellcome Trust/United Kingdom
- 076113/WT_/Wellcome Trust/United Kingdom
LinkOut - more resources
Full Text Sources
Other Literature Sources
Molecular Biology Databases
Research Materials
