SCOPE: a scorecard for osteoporosis in Europe
- PMID: 24030479
- PMCID: PMC3880480
- DOI: 10.1007/s11657-013-0144-1
SCOPE: a scorecard for osteoporosis in Europe
Abstract
Summary: The scorecard summarises key indicators of the burden of osteoporosis and its management in each of the member states of the European Union. The resulting scorecard elements were then assembled on a single sheet to provide a unique overview of osteoporosis in Europe.
Introduction: The scorecard for osteoporosis in Europe (SCOPE) is an independent project that seeks to raise awareness of osteoporosis care in Europe. The aim of this project was to develop a scorecard and background documents to draw attention to gaps and inequalities in the provision of primary and secondary prevention of fractures due to osteoporosis.
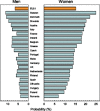
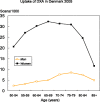
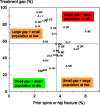
Methods: The SCOPE panel reviewed the information available on osteoporosis and the resulting fractures for each of the 27 countries of the European Union (EU27). The information researched covered four domains: background information (e.g. the burden of osteoporosis and fractures), policy framework, service provision and service uptake e.g. the proportion of men and women at high risk that do not receive treatment (the treatment gap).
Results: There was a marked difference in fracture risk among the EU27. Of concern was the marked heterogeneity in the policy framework, service provision and service uptake for osteoporotic fracture that bore little relation to the fracture burden. For example, despite the wide availability of treatments to prevent fractures, in the majority of the EU27, only a minority of patients at high risk receive treatment for osteoporosis even after their first fracture. The elements of each domain in each country were scored and coded using a traffic light system (red, orange, green) and used to synthesise a scorecard. The resulting scorecard elements were then assembled on a single sheet to provide a unique overview of osteoporosis in Europe.
Conclusions: The scorecard will enable healthcare professionals and policy makers to assess their country's general approach to the disease and provide indicators to inform future provision of healthcare.
Figures


Similar articles
-
SCOPE 2021: a new scorecard for osteoporosis in Europe.Arch Osteoporos. 2021 Jun 2;16(1):82. doi: 10.1007/s11657-020-00871-9. Arch Osteoporos. 2021. PMID: 34080059 Free PMC article.
-
Osteoporosis in the European Union: a compendium of country-specific reports.Arch Osteoporos. 2013;8(1):137. doi: 10.1007/s11657-013-0137-0. Epub 2013 Oct 11. Arch Osteoporos. 2013. PMID: 24113838 Free PMC article. Review.
-
Osteoporosis in the European Union: medical management, epidemiology and economic burden. A report prepared in collaboration with the International Osteoporosis Foundation (IOF) and the European Federation of Pharmaceutical Industry Associations (EFPIA).Arch Osteoporos. 2013;8(1):136. doi: 10.1007/s11657-013-0136-1. Epub 2013 Oct 11. Arch Osteoporos. 2013. PMID: 24113837 Free PMC article. Review.
-
Osteoporosis in Europe: a compendium of country-specific reports.Arch Osteoporos. 2022 Jan 26;17(1):23. doi: 10.1007/s11657-021-00969-8. Arch Osteoporos. 2022. PMID: 35079919 Free PMC article.
-
A scorecard for osteoporosis in four Latin American countries: Brazil, Mexico, Colombia, and Argentina.Arch Osteoporos. 2019 Jun 27;14(1):69. doi: 10.1007/s11657-019-0622-1. Arch Osteoporos. 2019. PMID: 31250192
Cited by
-
FRAX-based intervention thresholds in eight Eurasian countries: Armenia, Belarus, Georgia, Kazakhstan, the Kyrgyz Republic, Moldova, the Russian Federation, and Uzbekistan.Arch Osteoporos. 2021 Jun 5;16(1):87. doi: 10.1007/s11657-021-00962-1. Arch Osteoporos. 2021. PMID: 34089424
-
Recent trends in the incidence of hip fracture in Tottori Prefecture, Japan: changes over 32 years.Arch Osteoporos. 2020 Oct 2;15(1):152. doi: 10.1007/s11657-020-00823-3. Arch Osteoporos. 2020. PMID: 33006016 Free PMC article.
-
Osteocrinology.Osteoporos Int. 2020 May;31(5):1013-1014. doi: 10.1007/s00198-020-05288-1. Epub 2020 Jan 16. Osteoporos Int. 2020. PMID: 31950203 No abstract available.
-
Epidemiology and economic burden of fragility fractures in Austria.Osteoporos Int. 2022 Mar;33(3):637-647. doi: 10.1007/s00198-021-06152-6. Epub 2021 Oct 8. Osteoporos Int. 2022. PMID: 34622302 Free PMC article.
-
The position of strontium ranelate in today's management of osteoporosis.Osteoporos Int. 2015 Jun;26(6):1667-71. doi: 10.1007/s00198-015-3109-y. Epub 2015 Apr 14. Osteoporos Int. 2015. PMID: 25868510 Review.
Publication types
MeSH terms
Grants and funding
LinkOut - more resources
Full Text Sources
Other Literature Sources
Medical
Miscellaneous

