. 2013 Sep;11(9):e1001647.
doi: 10.1371/journal.pbio.1001647. Epub 2013 Sep 3.

Analysis of the RelA:CBP/p300 interaction reveals its involvement in NF-κB-driven transcription

Affiliations

Analysis of the RelA:CBP/p300 interaction reveals its involvement in NF-κB-driven transcription

Sulakshana P Mukherjee et al. PLoS Biol. 2013 Sep.

Abstract

NF-κB plays a vital role in cellular immune and inflammatory response, survival, and proliferation by regulating the transcription of various genes involved in these processes. To activate transcription, RelA (a prominent NF-κB family member) interacts with transcriptional co-activators like CREB-binding protein (CBP) and its paralog p300 in addition to its cognate κB sites on the promoter/enhancer regions of DNA. The RelA:CBP/p300 complex is comprised of two components--first, DNA binding domain of RelA interacts with the KIX domain of CBP/p300, and second, the transcriptional activation domain (TAD) of RelA binds to the TAZ1 domain of CBP/p300. A phosphorylation event of a well-conserved RelA(Ser276) is prerequisite for the former interaction to occur and is considered a decisive factor for the overall RelA:CBP/p300 interaction. The role of the latter interaction in the transcription of RelA-activated genes remains unclear. Here we provide the solution structure of the latter component of the RelA:CBP complex by NMR spectroscopy. The structure reveals the folding of RelA-TA2 (a section of TAD) upon binding to TAZ1 through its well-conserved hydrophobic sites in a series of grooves on the TAZ1 surface. The structural analysis coupled with the mechanistic studies by mutational and isothermal calorimetric analyses allowed the design of RelA-mutants that selectively abrogated the two distinct components of the RelA:CBP/p300 interaction. Detailed studies of these RelA mutants using cell-based techniques, mathematical modeling, and genome-wide gene expression analysis showed that a major set of the RelA-activated genes, larger than previously believed, is affected by this interaction. We further show how the RelA:CBP/p300 interaction controls the nuclear response of NF-κB through the negative feedback loop of NF-κB pathway. Additionally, chromatin analyses of RelA target gene promoters showed constitutive recruitment of CBP/p300, thus indicating a possible role of CBP/p300 in recruitment of RelA to its target promoter sites.


Conflict of interest statement

The authors have declared that no competing interests exist.

Figures
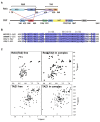
Figure 1
Figure 1. The intrinsically disordered RelA transactivation domain folds on the TAZ1 domain of CBP.
(A) Schematic of domain organization of RelA and CBP. The approximate boundaries for CBP were taken from the uniprotkB database (primary accession number P45481). * denotes the nuclear localization signal (NLS). (B) Sequence alignment of mammalian RelA–TA2 region. The ψXXψψ motifs and the ψψXXψXXψ sequence are marked over the sequence, where ψ is a hydrophobic residue and X can be any residue. The sequence alignment was done using Jalview Version 2 software . (C) [15N-1H]-HSQC spectra of 15N labeled free RelA–TA2 (425–490) (upper left panel), 15N labeled RelA–TA2 in complex with unlabeled TAZ1 (340–349) (upper right panel), 15N labeled free TAZ1 (lower left panel), and 15N labeled TAZ1 in complex with unlabeled RelA–TA2 (lower right panel). [15N-1H]-HSQC spectra with narrow dispersion in the 1H dimension as observed for the free RelA–TA2 fragment indicate unstructured protein.
Figure 2
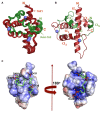
Figure 2. NMR structure of the RelA–TA2:CBP–TAZ1 complex.
RelA–TA2 is shown in green and TAZ1 in red. The three Zn2+ ligands are depicted in blue. The ordered region of the RelA fragment (Leu434–Val481) and TAZ1 (Ala345–Asp437) is depicted unless otherwise mentioned. (A) Twenty superimposed lowest energy NMR structures of RelA–TA2:CBP–TAZ1 complex. (B) Cartoon depiction of the lowest energy model of RelA–TA2:CBP–TAZ1 complex. (C) Electrostatic potential of solvent accessible surface of TAZ1 in complex with RelA–TA2. The positive potential is shown in blue and the negative in red. RelA–TA2 is shown as green ribbon with its acidic residues shown as red ball-and-sticks. RelA fragment (Gly430–Met483) is depicted in this figure.
Figure 3
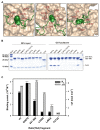
Figure 3. RelA–TA2 docks itself onto a series of interlinked hydrophobic grooves of TAZ1 through a number of hydrophobic residues, which serve as anchor points.
Disruption of any of the anchor points leads to the destabilization of the whole binding architecture of the complex. ∼2,800 Å2 of RelA–TA2 surface area are buried upon formation of RelA–TA2:TAZ1 complex. (A) Leu449 (left panel), Leu465 (middle panel), and Phe473 (right panel) residues of RelA–TA2 (shown as green spheres) buried into each face of the interlinked hydrophobic grooves of TAZ1. Residues of TAZ1 making contacts with the above mentioned hydrophobic residues of RelA are shown as red sticks. The other hydrophobic residues of RelA–TA2—namely, Leu452, Val468, Leu476, and Leu477—making vital contacts with TAZ1 are depicted as green sticks. (B) GST-pulldown experiments performed on the RelA–TA2 mutants binding to TAZ1. RelA fragment (Lys425–Pro490) with N-terminal GST-tag was used as the wild-type protein. All the mutations were made using this construct as a template. (C) Vertical bar chart of the association constants (left vertical axis, black bars) and enthalpy change (right vertical axis, grey bars) obtained from the ITC binding isotherms of the RelA–TA2:TAZ1 interaction corresponding to the respective RelA–TA2 wt and mutants (see Figure S5). The Leu449Ala and Leu465Ala mutants in RelA–TA2 lead to diminished association constants accompanied with decreased negative enthalpy change. The Phe473Ala mutant showed no binding (NB).
Figure 4
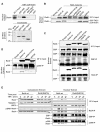
Figure 4. Separating the components of the bipartite RelA:CBP interaction to delineate their individual roles.
(A, Upper panel) GST-pulldown assay using in-vitro purified GST–KIX/GST–TAZ1 to pull down nRelA from NEs of wild-type 3T3 cells stimulated with TNFα for 30 min. EDTA was used to remove the Zn2+ from TAZ1, thereby disrupting the TAZ1 structure. (Lower panel) Coomassie-stained SDS-PAGE gel showing the inputs for the GST-tagged proteins. (B) GST-pulldown assay using in vitro purified GST–TAZ1 to pull down nRelA from the NEs of RelA(wt/mutants) reconstituted rela / cells stimulated with TNFα for 30 min. RelA(Leu449Ala+Phe473Ala) and RelA(Leu449Ala+Phe473Ala+Ser467Ala) mutants have slower mobility on SDS-PAGE gels due to unknown reasons. The expression level of the RelA(Ser276Ala) mutant in the reconstituted cell line was lower than that for the RelA(wt) (see Figure S6). Hence, a 3-fold excess of NEs was used for the RelA(Ser276Ala) mutant in this experiment. (C) Interaction of endogenous CBP with nRelA from the NEs of RelA(wt/mutants) reconstituted rela / cells stimulated with TNFα for 30 min studied by co-immunoprecipitation assay of CBP/RelA followed by immunoblotting by RelA/CBP. The amount of NEs used for RelA(Ser276Ala) mutants was three times that of RelA(wt/TA2) mutants due to its lower expression levels. The RelA(Ser276Ala+Leu449Ala+Phe473Ala) mutant, which could potentially abolish the total RelA:CBP interaction, showed low and inconsistent expression and hence was not used in this study. * denotes IgG heavy chain. (D) The RelA mutants defective in RelA:CBP interaction also are defective binding to p300. The co-IP experiments for p300 was performed similarly to those in panel (C) of this figure. (E) RelA phosphorylated at Ser467 has higher CBP/p300 binding potential than the nonphosphorylated form. The immunoprecipitation assay was performed with α-RelA on CE (left column panels) and NE (right column panels) of rela / cells reconstituted with RelA(wt) or RelA(Ser467Ala) mutant at three different time intervals after being stimulated with TNFα (5 ng/ml) in addition to the unstimulated cells. Co-immunoprecipitation assays were performed with α-CBP and α-p300 on NE in exactly the same manner as for the IP experiments above. The recruitment of nRelA by CBP/p300 is similar at 15 min relative to 30 min but diminishes at 45 min after TNFα stimulation despite the concentration of total RelA in the nucleus being significantly lower at 15 min after stimulation. Identical co-IP experiments with the RelA(Ser467Ala) mutant shows a direct proportionality in CBP/p300 binding with the concentrations of total nRelA at the different time points after stimulation. This indicates that the exclusively nuclear p-Ser467–RelA whose concentration peaks at about 10 to 15 min post-TNFα stimulation possesses a higher binding affinity for CBP/p300 compared to the nonphosphorylated form.
Figure 5
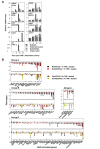
Figure 5. A subset of RelA:CBP/p300 dependent genes is independent of RelA(Ser276) phosphorylation.
(A) Total RNA was isolated and purified from unstimulated cells at 30, 60, and 120 min of TNFα stimulation and prepared for analysis by RT-PCR. GAPDH was used as a reference and the 0 min time point for each cell line was used as the calibrator. The respective protein products of the genes (with names other than the gene name) are in parentheses. The rela / cell line reconstituted with empty vector was included to ensure that RelA regulates the genes under study. The genes with their respective gene accession numbers (mouse) are as follows: csf2 (NM_009969), cxcl2 (NM_009140), icam1 (NM_010493), nfkbia (NM_010907), ptgs2 (NM_011198), tnf (NM_013693), tnfaip3 variant 1 (NM_009397), tnfaip3 variant 2 (NM_001166402), tnfsf9 (NM_009404), and vcam1 (NM_011693). Note that tnfaip3 has two variants. (B) The RelA–TA2:TAZ1 interaction activates a set of RelA target genes independent of p-Ser276RelA. The expression phenotype was determined for 99 genes that undergo at least 2-fold activation at 1 h of TNFα stimulation as compared to unstimulated RelA(wt) reconstituted rela / cells. These TNFα-activated genes were grouped into four groups, A–D, based on the observed expression defect (with 95% confidence) with respect to RelA(wt), in the two distinct RelA:CBP/p300 interaction defective mutant cells (see main text). The gene list was sorted according to the differences between the RelA(wt) and RelA(TA2) mutant reconstituted cells at 1 h of TNFα treatment. The genes that switch to other groups upon relaxation of the confidence limit to 67% are labeled with their prospective group names. The genes that were tested by qPCR are marked with a blue asterisk. vcam1 did not satisfy the stringent criteria of at least 2-fold activation at 1 h of TNFα treatment and hence could not enter the list.
Figure 6
Figure 6. Impaired RelA–TA2:CBP–TAZ1 interaction disrupts the negative feedback loop of the NF-κB pathway.
(A) Expression of RelA mutants with respect to RelA(wt) in the RelA reconstituted rela / cell lines. The protein expression levels of RelA(Ser276Ala) mutant was about three times lower than that for RelA(wt). For the quantitative estimation, the RelA to Actin signal ratio for each cell line was normalized with that for the RelA(wt) reconstituted rela / cells (lower panel). (B) Model predictions for NF-κB (top) and total IκBα abundance (bottom) for different RelA expression levels (2×, 1.5×, 1×, 0.5×, and 0.2× relative to RelA(wt) values). In the nNF-κB curves, the peak is normalized to one for the highest level of nNF-κB activity and to zero for its levels in the resting cells (time = 0 min) for each individual expression level. Similarly, for the IκBα curves, the amount of IκBα in the resting cell (time = 0 min) is normalized to one and the minimum amount after degradation (basal levels) to zero following TNFα stimulation. (C) nRelA activity assay in response to TNFα stimulation as measured by EMSA using labeled κB probe and control NF-Y probe in the above-mentioned cells. The activity due to RelA binding to the κB probe was indicated by supershift of the EMSA band corresponding to the probe-bound NF-κB detected with anti-RelA antibody. 12 µg of NE was used for EMSA. (D) IκBα degradation and regeneration assay in RelA(wt/mutants) reconstituted rela / cells following TNFα stimulation. IκBα protein levels after stimulation were monitored with respect to Actin. (E) Comparison of experimentally determined (symbols) and model predictions (solid line) based on adjusted RelA levels for NF-κB (left) and total IκBα abundance (right). Time courses for rela / cells reconstituted with RelA(wt) (top), RelA(TA2) mutant (middle), and RelA(Ser276Ala) (bottom) stimulated with TNFα are shown. The experimental data were normalized as mentioned in panel (B) of this figure. The RMSD values correspond to the combined NF-κB and IκB datasets. (F) Comparison of experimentally determined (•) and model predictions (solid line) for NF-κB (left column) and total IκBα abundance (right column) for different degrees of suppression of IκBα mRNA production for RelA(TA2) mutant reconstituted rela / cells.
Figure 7
Figure 7. The RelA:CBP/p300 interaction influences RelA recruitment to its target gene promoters.
ChIP was performed to analyze the chromatin of six TNFα-induced RelA target genes in unstimulated and TNFα (5 ng/ml) stimulated for 30 and 60 min RelA(wt/mutants) reconstituted rela / cells. Immunoprecipitation using antibodies against RelA, CBP, p300, histone H3, and H3K27ac were performed. The H3K27ac antibody showed higher signals compared to the total H3 antibody due to differences in their qualities. The results shown are the average of two independent replicates, with standard deviations shown as error bars. (A) Fold enrichment of RelA on the promoter of six RelA target genes after TNFα treatment relative to that in unstimulated cells. (B) CBP/p300 enrichment as depicted by the respective %input for six RelA target genes in unstimulated and TNFα-stimulated RelA(wt/mutants) reconstituted rela / cells. (C) Comparison of RelA, CBP, p300, H3, and H3K27ac ChIP signals in unstimulated RelA(wt) reconstituted rela / cells for six RelA target genes.

Similar articles

Cited by

References

    1. Hayden MS, West AP, Ghosh S (2006) NF-kappaB and the immune response. Oncogene 25: 6758–6780. - PubMed
    1. Natoli G, Saccani S, Bosisio D, Marazzi I (2005) Interactions of NF-kappaB with chromatin: the art of being at the right place at the right time. Nat Immunol 6: 439–445. - PubMed
    1. Siggers T, Chang AB, Teixeira A, Wong D, Williams KJ, et al. (2012) Principles of dimer-specific gene regulation revealed by a comprehensive characterization of NF-kappaB family DNA binding. Nat Immunol 13: 95–102. - PMC - PubMed
    1. Gerritsen ME, Williams AJ, Neish AS, Moore S, Shi Y, et al. (1997) CREB-binding protein/p300 are transcriptional coactivators of p65. Proc Natl Acad Sci U S A 94: 2927–2932. - PMC - PubMed
    1. Yamit-Hezi A, Dikstein R (1998) TAFII105 mediates activation of anti-apoptotic genes by NF-kappaB. EMBO J 17: 5161–5169. - PMC - PubMed

Publication types

MeSH terms

Associated data