. 2014 Jan 15;23(2):368-82.
doi: 10.1093/hmg/ddt427. Epub 2013 Sep 5.

Small RNAs derived from lncRNA RNase MRP have gene-silencing activity relevant to human cartilage-hair hypoplasia

Affiliations

Small RNAs derived from lncRNA RNase MRP have gene-silencing activity relevant to human cartilage-hair hypoplasia

Leslie E Rogler et al. Hum Mol Genet. .

Abstract

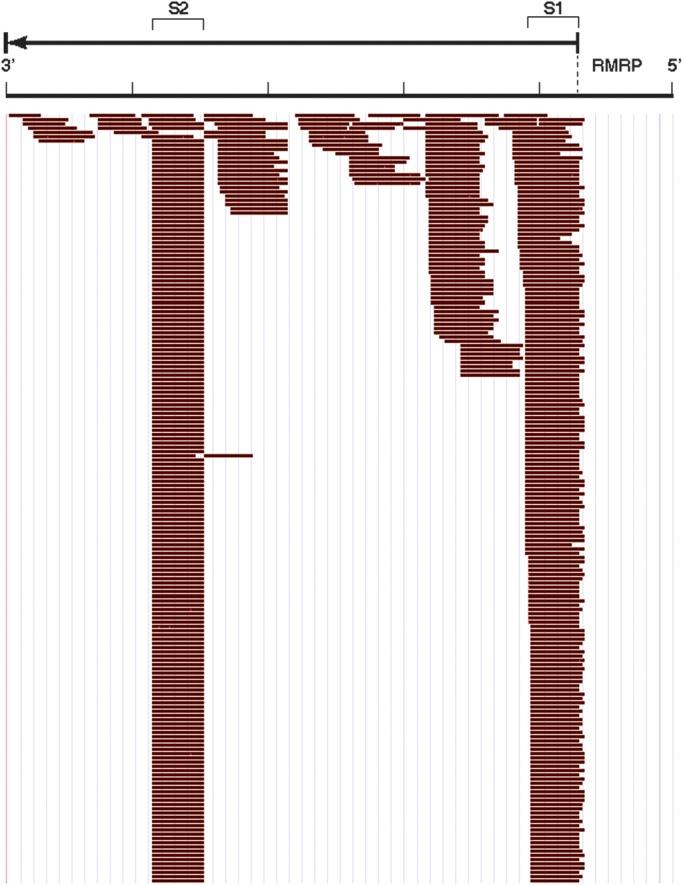
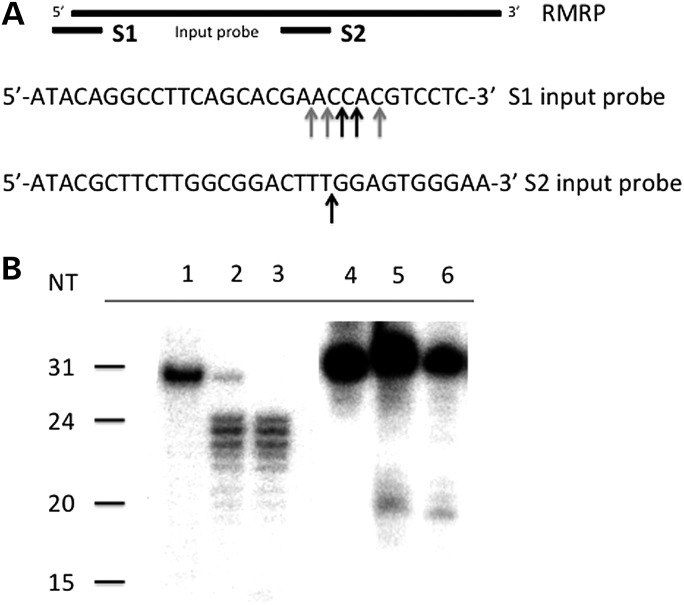
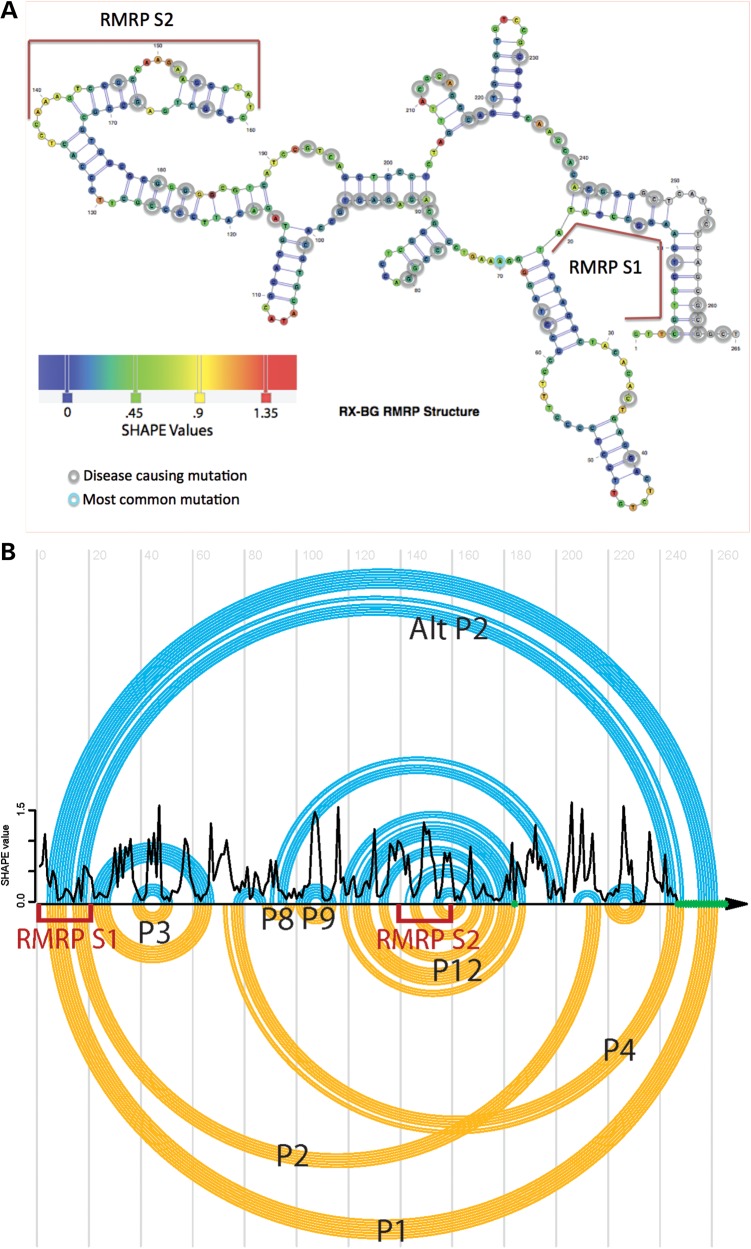
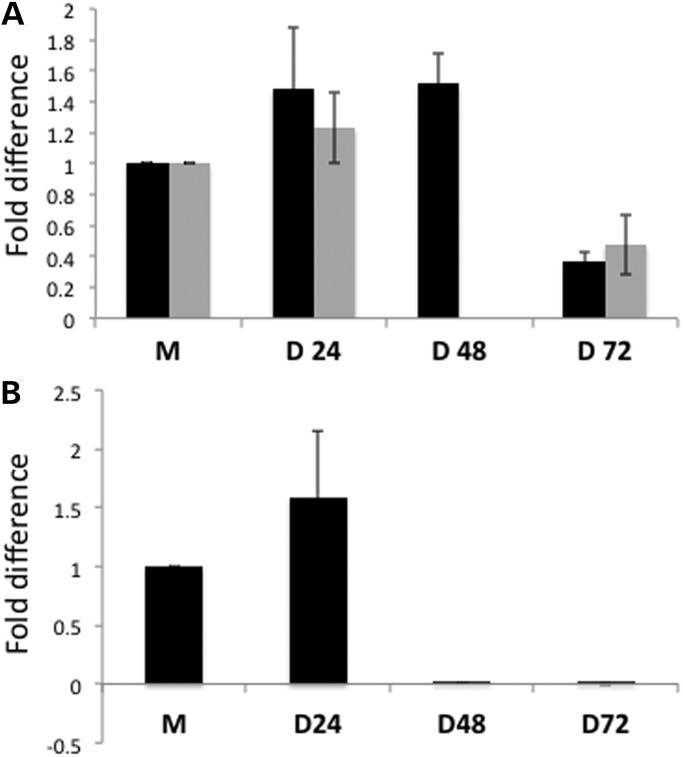
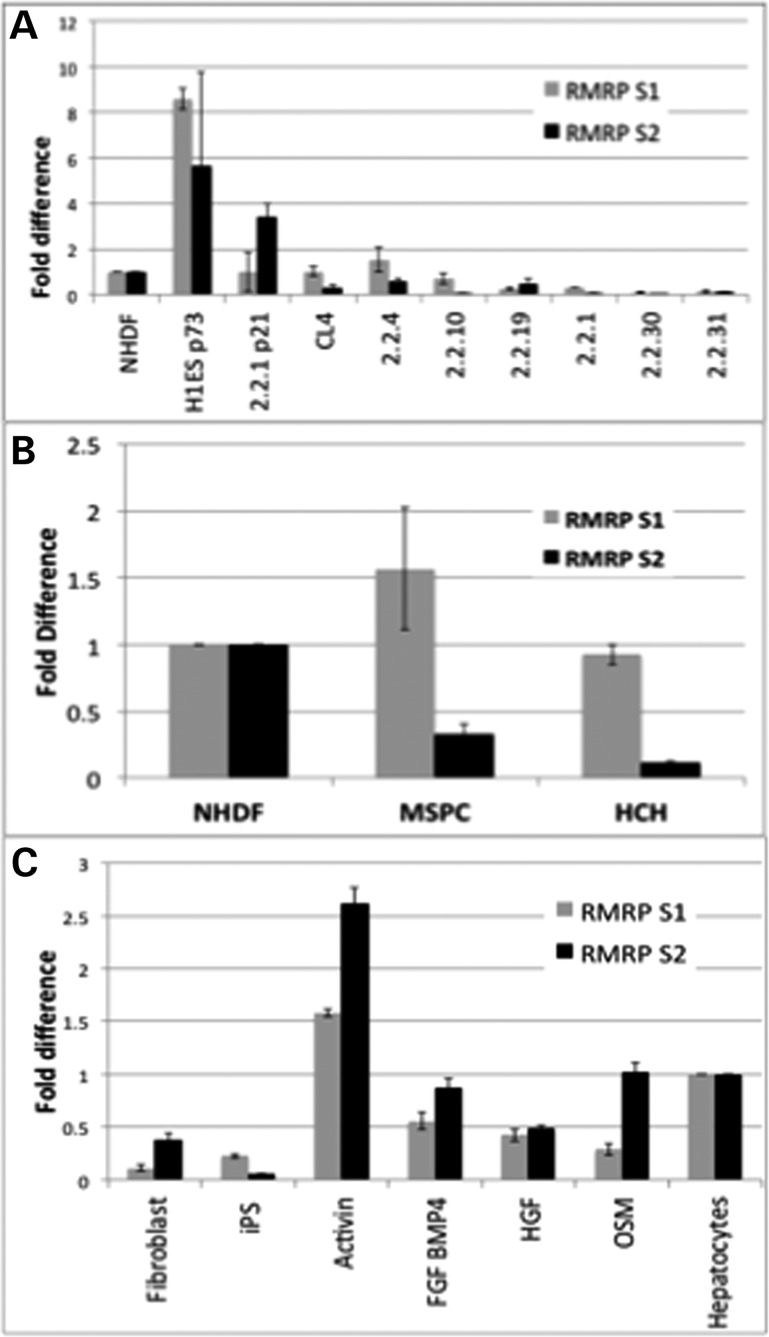
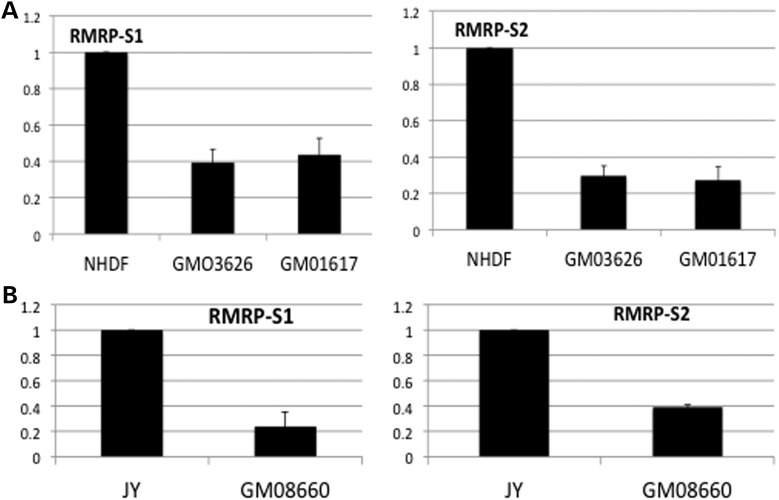
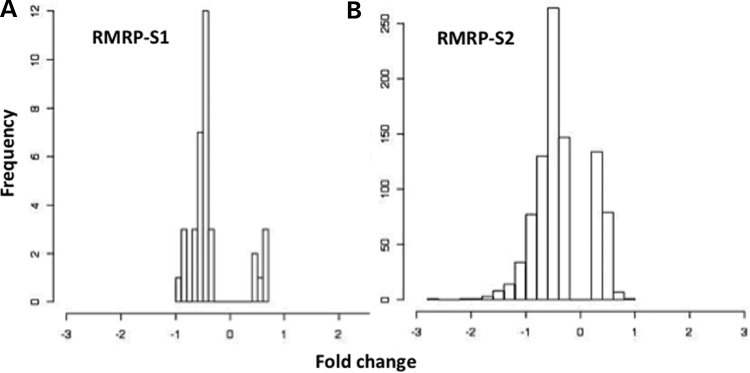
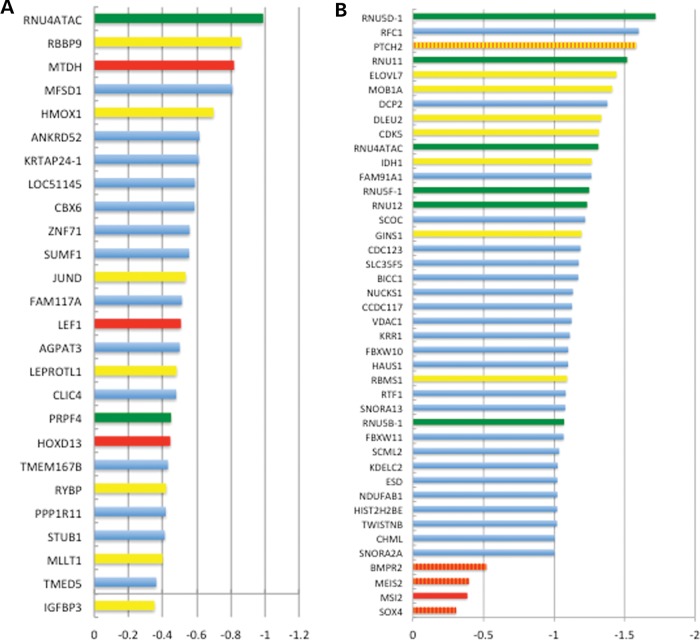
Post-transcriptional processing of some long non-coding RNAs (lncRNAs) reveals that they are a source of miRNAs. We show that the 268-nt non-coding RNA component of mitochondrial RNA processing endoribonuclease, (RNase MRP), is the source of at least two short (∼20 nt) RNAs designated RMRP-S1 and RMRP-S2, which function as miRNAs. Point mutations in RNase MRP cause human cartilage-hair hypoplasia (CHH), and several disease-causing mutations map to RMRP-S1 and -S2. SHAPE chemical probing identified two alternative secondary structures altered by disease mutations. RMRP-S1 and -S2 are significantly reduced in two fibroblast cell lines and a B-cell line derived from CHH patients. Tests of gene regulatory activity of RMRP-S1 and -S2 identified over 900 genes that were significantly regulated, of which over 75% were down-regulated, and 90% contained target sites with seed complements of RMRP-S1 and -S2 predominantly in their 3' UTRs. Pathway analysis identified regulated genes that function in skeletal development, hair development and hematopoietic cell differentiation including PTCH2 and SOX4 among others, linked to major CHH phenotypes. Also, genes associated with alternative RNA splicing, cell proliferation and differentiation were highly targeted. Therefore, alterations RMRP-S1 and -S2, caused by point mutations in RMRP, are strongly implicated in the molecular mechanism of CHH.


Figures

Figure 1.
Figure 1.
Profile of small RNA reads across RMRP from miSeq library prepared from normal liver. RMRP gene is represented 5′ to 3′ (right to left) with the RMRP RNA sequence denoted by the arrow above the read profile. S1- and S2-labeled brackets denote the segments identified as RMRP-S1 and RMRP-S2, respectively. Individual reads identified by Maroon Bars below the gene. No antisense RNA reads were detected. The sequence profiles of S1 and S2 were cut off at the same depth of reads for illustration purposes. The ratio of depth of reads for S1/S2 in normal liver was 0.19 and for cirrhotic liver (profile not shown) was 2.0.
Figure 2.
Figure 2.
Mapping of 5′ ends of RMRP-S1 and -S2. (A) Top lines, locations of input probes S1 and S2 on the full-length RMRP gene (left–right 5′–3′). Sequences of the S1 and S2 input probes below the map. Arrows denote locations of transcript start sites determined by S1 nuclease protection shown in (B). Black arrows, equal strongest bands; gray arrows, less strong bands. (B) S1 nuclease protection assay results. Lane 1: input probe for RMRP-S1; Lanes 2 and 3: protected fragments in two different cirrhotic liver RNAs. Lane 4: input probe for RMRP-S2; Lanes 5 and 6: protected fragments in two cirrhotic liver RNAs.
Figure 3.
Figure 3.
Northern blot analysis of RMRP RNAs in cirrhotic liver, HEK293 cells and MSPCs. (A) Northern blot analysis of cirrhotic liver RNA with antisense probes to RMRP-S1 and -S2-detected small RNAs of 22 and 20 nt, respectively. Lane 1: probe detecting RMRP-S1; Lane 2: probe detecting RMRP-S2. Left markers in nucleotides, full-length RMRP = 268 nt. (B) Northern blot detection of RMRP-S1 and RMRP-S2 in HEK293 cells. Lane 1: HEK293 RNA hybridized with probe 5′ nt 1–20. Fragments at ∼21–23 are RMRP-S1. Lane 2: HEK293 RNA hybridized with probe 5′ nt 21–40. Note fragment at ∼23 nt that is similar to RMRP fragment detected by Maida (35). Lane 3: HEK293 RNA hybridized with probe 5′ nt 140–160. Fragment at ∼20 nt is RMRP-S2. (C) Northern blot detection and mapping of RMRP fragments using 5′ and 3′ end probes 01 (5′ end) and 10 (3′ end, nt 240–268). Northern blot used total RNA from MSPC. Lane 1: northern blot of RMRP detected by 5′ end probe O1 (nt 1–20). Note two prominent bands at 20–22 nt designated as RMRP-S1. Lane 2: northern blot of RMRP detected by 3′ end probe O10 (nt 240–268).
Figure 4.
Figure 4.
(A) RMRP secondary structure determined by SHAPE chemical probing. Red bars alongside the structure denote location of RMRP-S1 and -S2. Gray circles: nucleotides associated with disease causing mutations in CHH (4, 15). Blue to orange heat bar of SHAPE values represents the degree of confidence in single strand at that position as determined by SHAPE chemical mapping. Orange = high confidence; blue = low confidence. (B) Comparison of the RMRP secondary structures determined by SHAPE analysis versus previously published structures. Top, blue circles: RMRP secondary structures determined using SHAPE chemical mapping bottom, Yellow circles: previously published based on RNA co-variation analysis and some chemical and enzymatic probing (15). The structures are drawn as ‘arc’ diagrams using the R-CHIE R package for visualizing RNA (41). Each arc in the diagram represents a base pair, and the RNA sequence is represented as a horizontal line. Left = 5′ end of RMRP, Right = 3′ end of RMRP. RED brackets locations of RMRP-S1 and RMRP-S2. Crossing Arcs identify pseudoknots. In addition, they allow a direct comparison of the structures. In this case, we observe that the SHAPE structure (top, blue) does not have a pseudoknot, while the evolutionarily derived structure (bottom, yellow) does between the P2 and P4 helices. The SHAPE-derived structure instead suggests the formation of an Alternative P2 helix (Alt-P2) that effectively resolves the pseudoknot. We used the SHAPEknots approach to confirm that the SHAPE data are not consistent with the P2–P4 pseudoknot under our solution conditions. In addition, we observe intermediate-to-high SHAPE reactivity for nucleotides 205–217, which include the 3′ end of the P2 helix shown as a black trace in Figure 4B. Nucleotides where it was not possible to obtain SHAPE data are indicated in green. Our SHAPE data are thus consistent with RMRP adopting two alternative conformations (P2 and Alt-P2).
Figure 5.
Figure 5.
Reduction in RMRP-S1 and RMRP-S2 follows Dicer knockdown. (A) TaqMan assays measuring the time course of knockdown of RMRP-S1 and -S2 after Dicer knockdown. Black bars: RMRP-S1, gray bars: RMRP-S2. 48 h RMRP-S2 was not determined. (B) Time course of knockdown of Dicer mRNA after siRNA transfection determined by QRT-PCR assay. Fold difference = 2(−ddCt)+ _SEM (n = 6 for each sample). M = mock; D24, D48 and D72 = 24, 48 and 72 h post-transfection with Dicer siRNA.
Figure 6.
Figure 6.
(A) Human ES cells and selected human iPS cell lines express elevated levels of RMRP-S1 and -S2 compared with NHDF. Quantitative analysis of S1 and S2 levels in H1ES cells (H1ES p73) and 8 independently derived hiPS lines (left to right, 2.2.1 p21, CL4, 2.2.4, 2.2.10, 2.2.19, 2.2.1, 2.2.30, 2.2.31). (Gray bars) RMRP-S1 and (black bars) RMRP-S2 levels were measured by custom Taqman assay (Materials and Methods). Data were normalized using miR-16 expression, and the fold difference was calculated using NHDF as normalization control = 1. Fold difference = 2(−ddCt) + _SEM (n = 6 for each sample). Relative to NHDF, the levels of RMRP-S1 and -S2 were 8-fold and 5-fold higher in the standard human ES cell line at passage 73, H1ESp73. (B) Quantitative analysis of RMRP-S1 (gray bars) and RMRP-S2 (Black bars) in MSPC, fetal human bone marrow derived MSPC, and HCH, primary Human Chondrocytes. NHDF, normal human dermal fibroblasts, used as the reference sample. Levels were measured by Taqman assay as in Figure 5. Data were normalized using miR-16 expression, and the fold difference was calculated using NHDF as normalization control = 1. Fold difference = 2(−ddCt) + _SEM. (N = 6 for each sample). (C) The levels of RMRP-S1 and -S2 are altered during differentiation of human iPS cells. Quantitative changes in RMRP-S1 and -S2 as hiPS are induced toward the hepatocyte lineage were measured by Taqman assay of total cellular RNA. RMRP-S1 (gray bars) and RMRP-S2 (black bars), treatments at each stage listed below bars. Fibroblast: normal cultured human primary fibroblasts. iPS: human iPS clone Activin: Stage 1, hiPS treated with Activin. FGF/BMP4: Stage 2, cells treated with FGF and BMP4. HGF: Stage 3, cells treated with human Hepatocyte Growth Factor. OSM: Stage 4. cells treated with Oncostatin M. Hepatocytes: freshly isolated human hepatocytes were used as the reference sample (45). Data were normalized using miR-16 expression, and the fold difference was calculated using NHDF as normalization control = 1. Fold difference = 2(−ddCt) + _SEM. (n = 3 for each sample).
Figure 7.
Figure 7.
(A) Primary fibroblasts isolated from CHH patients express significantly lower levels of RMRP-S1 and RMRP-S2 compared with NHDF. Taqman assays specifically detecting RMRP-S1 (left) or RMRP-S2 (right). (NHDF) total RNA isolated from primary NHDF and (GMO3626 and GMO1617) two independent of primary fibroblast isolations from CHH patients with homozygous 70A>G mutation. Data were normalized using miR-16 expression, and the fold difference was calculated using NHDF as normalization control = 1. Fold difference = 2(−ddCt) + _SEM. (n = 9 for each determination). Error bars = ±SEM. (B) EBV-immortalized B cells from a CHH patient express reduced levels of RMRP-S1 and RMRP-S2 compared with normal JY-immortalized B cells. Quantitative analysis of RMRP-S1 (left) and RMRP-S2 (right) in CHH-immortalized B cells, GM08660 (156G>C) compared with JY EBV-immortalized B lymphoblastoid cells, assayed by custom TaqMan assays. Data were normalized using miR-16 expression, and the fold difference was calculated using JY cells as control. Fold difference = 2(−ddCt) + _SEM. (n = 9 for each determination).
Figure 8.
Figure 8.
Frequency and degree of gene regulation by transfection of mimics and inhibitors of (A) RMRP-S1 and (B) RMRP-S2. Degree of regulation versus a negative control is plotted as the cumulative fold change [Log 2 (mimic regulation minus inhibitor regulation)]. Only significantly up- or down-regulated genes are plotted on the bar graph leaving a blank central area for unregulated genes.
Figure 9.
Figure 9.
Bar graphs depicting the most highly down-regulated genes by RMRP-S1 (A) and RMRP-S2 (B). Colored bars denote genes in enriched categories according to IPA. Red bars: hematopoietic genes; green bars: splicing genes; yellow bars: growth and proliferation genes; orange bars: bone growth and development genes. Blue bars: varied functional categories including transcription factors, tumor suppressors and other structural and regulatory genes. Yellow/orange striped bar: bone growth and proliferation. Orange and red striped bar: bone growth and hematopoietic gene.
Figure 10.
Figure 10.
Regulation of PTCH2 and SOX4 by transfection of RMRP mimics or inhibitors. (A) Increase in PTCH2 RNA after transfection of either RMRP-S1 or RMRP-S2 inhibitors in HEK293 cells determined by Syber green qRT-PCR. (B) Increase in SOX4 levels determined by Syber green qRT-PCR. Fold difference = 2(−ddCt) + _SEM. (n = 9 for each determination). (C) Western blot detection of regulation of PTCH2 and SOX4 protein after treatment of HEK293 with mimics (Mimic) or inhibitors (Inh) of RMRP-S1 or RMRP-S2.

Similar articles

Cited by

References

    1. Ridanpaa M., van Eenennaam H., Pelin K., Chadwick R., Johnson C., Yuan B., van Venrooij W., Pruijn G., Salmela R., Rockas S., et al. Mutations in the RNA component of RNase MRP cause a pleiotropic human disease, cartilage-hair hypoplasia. Cell. 2001;104:195–203. - PubMed
    1. Ridanpaa M., Jain P., McKusick V.A., Francomano C.A., Kaitila I. The major mutation in the RMRP gene causing CHH among the Amish is the same as that found in most Finnish cases. Am. J. Med. Genet. 2003;121C:81–83. - PubMed
    1. Hermanns P., Tran A., Munivez E., Carter S., Zabel B., Lee B., Leroy J.G. RMRP Mutations in cartilage-hair hypoplasia. Am. J. Med. Genet. 2006;140:2121–2130. - PubMed
    1. Thiel C.T., Mortier G., Kaitila I., Reis A., Rauch A. Type and level of RMRP functional impairment predicts phenotype in the cartilage hair hypoplasia-anauxetic dysplasia spectrum. Am. J. Hum. Genet. 2007;81:519–529. - PMC - PubMed
    1. McKusick V.A., Eldridge R., Hostetler J.A., Ruangwit U., Egeland J.A. Dwarfism in the Amish. Ii. Cartilage-Hair Hypoplasia. Bull. Johns Hopkins Hosp. 1965;116:285–326. - PubMed

Publication types

MeSH terms

Supplementary concepts