

Delineation of the GPRC6A receptor signaling pathways using a mammalian cell line stably expressing the receptor
- PMID: 24008333
- PMCID: PMC11047948
- DOI: 10.1124/jpet.113.206276
Delineation of the GPRC6A receptor signaling pathways using a mammalian cell line stably expressing the receptor
Abstract
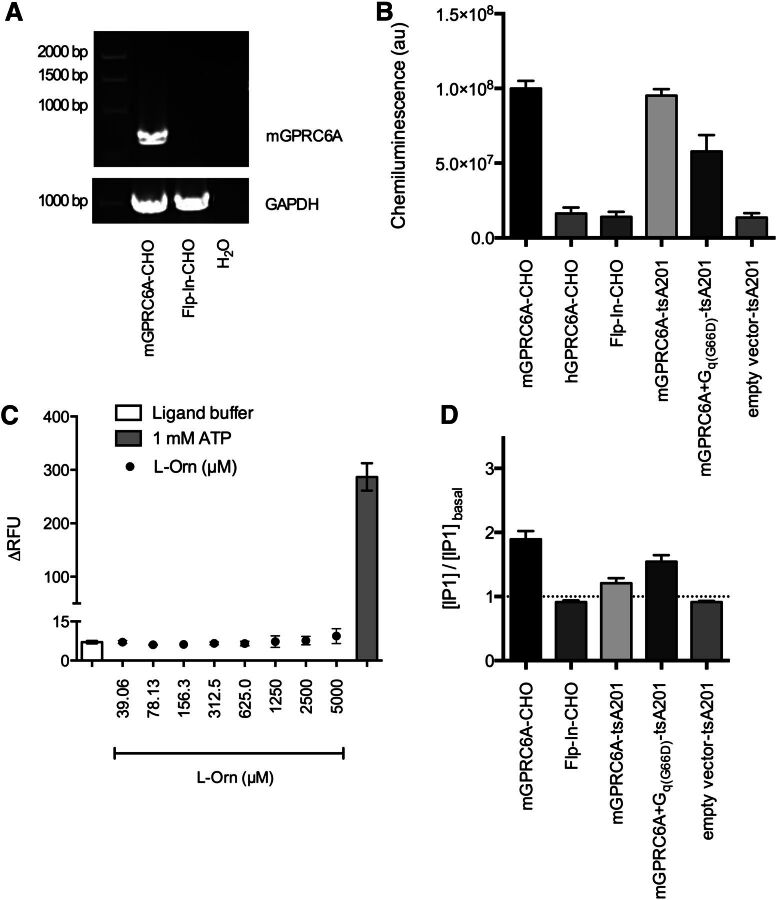
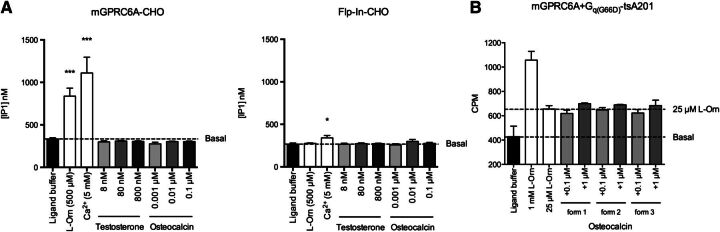
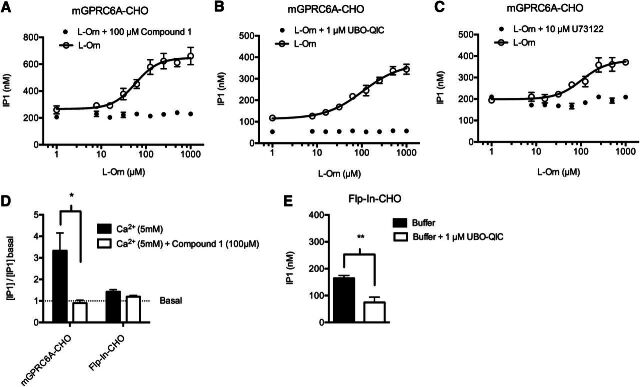
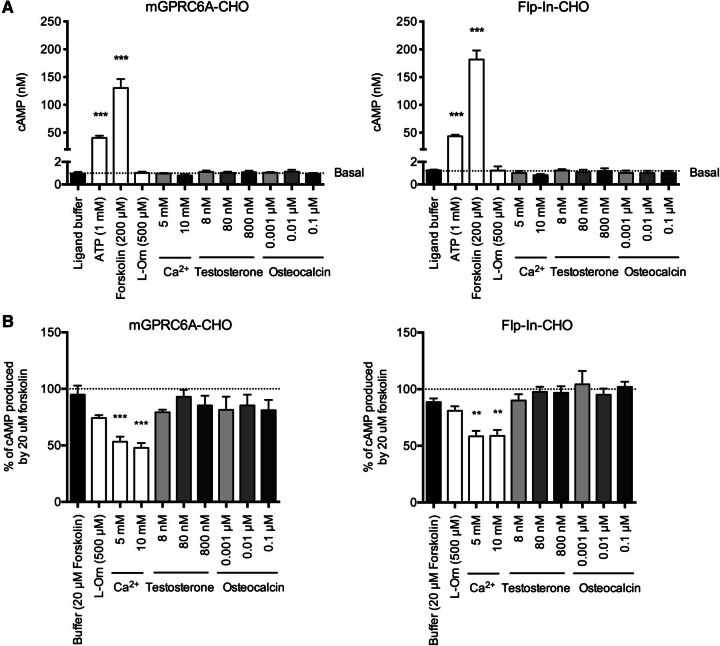
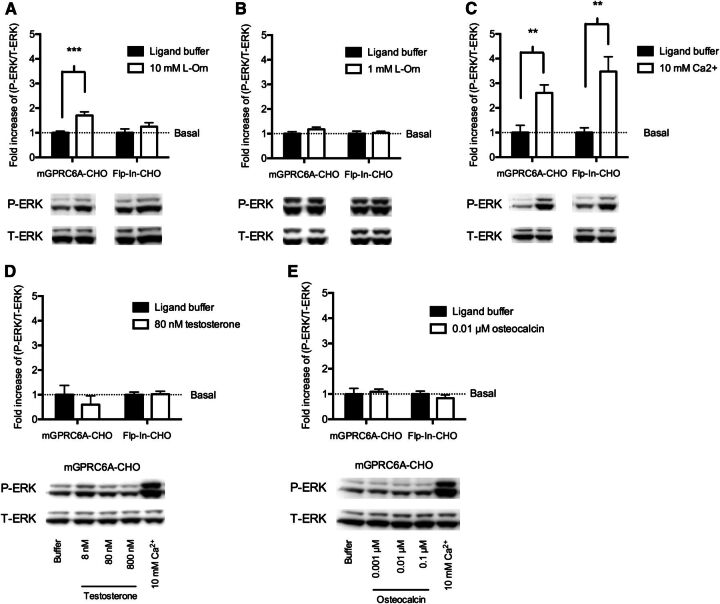
The GPRC6A receptor is a recently "deorphanized" class C G protein-coupled receptor. We and others have shown that this receptor is coactivated by basic l-α-amino acids and divalent cations, whereas other groups have also suggested osteocalcin and testosterone to be agonists. Likewise, the GPRC6A receptor has been suggested to couple to multiple G protein classes albeit via indirect methods. Thus, the exact ligand preferences and signaling pathways are yet to be elucidated. In the present study, we generated a Chinese hamster ovary (CHO) cell line that stably expresses mouse GPRC6A. In an effort to establish fully the signaling properties of the receptor, we tested representatives of four previously reported GPRC6A agonist classes for activity in the Gq, Gs, Gi, and extracellular-signal regulated kinase signaling pathways. Our results confirm that GPRC6A is activated by basic l-α-amino acids and divalent cations, and for the first time, we conclusively show that these responses are mediated through the Gq pathway. We were not able to confirm previously published data demonstrating Gi- and Gs-mediated signaling; neither could we detect agonistic activity of testosterone and osteocalcin. Generation of the stable CHO cell line with robust receptor responsiveness and optimization of the highly sensitive homogeneous time resolved fluorescence technology allow fast assessment of Gq activation without previous manipulations like cotransfection of mutated G proteins. This cell-based assay system for GPRC6A is thus useful in high-throughput screening for novel pharmacological tool compounds, which are necessary to unravel the physiologic function of the receptor.
Figures

Similar articles
-
The GPCR, class C, group 6, subtype A (GPRC6A) receptor: from cloning to physiological function.Br J Pharmacol. 2014 Mar;171(5):1129-41. doi: 10.1111/bph.12365. Br J Pharmacol. 2014. PMID: 24032653 Free PMC article. Review.
-
Human GPRC6A Mediates Testosterone-Induced Mitogen-Activated Protein Kinases and mTORC1 Signaling in Prostate Cancer Cells.Mol Pharmacol. 2019 May;95(5):563-572. doi: 10.1124/mol.118.115014. Epub 2019 Mar 20. Mol Pharmacol. 2019. PMID: 30894404 Free PMC article.
-
Pharmacological characterization of mouse GPRC6A, an L-alpha-amino-acid receptor modulated by divalent cations.Br J Pharmacol. 2007 Mar;150(6):798-807. doi: 10.1038/sj.bjp.0707121. Epub 2007 Jan 22. Br J Pharmacol. 2007. PMID: 17245368 Free PMC article.
-
Murine GPRC6A Mediates Cellular Responses to L-Amino Acids, but Not Osteocalcin Variants.PLoS One. 2016 Jan 19;11(1):e0146846. doi: 10.1371/journal.pone.0146846. eCollection 2016. PLoS One. 2016. PMID: 26785252 Free PMC article.
-
Explaining Divergent Observations Regarding Osteocalcin/GPRC6A Endocrine Signaling.Endocrinology. 2021 Apr 1;162(4):bqab011. doi: 10.1210/endocr/bqab011. Endocrinology. 2021. PMID: 33474566 Free PMC article. Review.
Cited by
-
GPRC6a is not required for the effects of a high-protein diet on body weight in mice.Obesity (Silver Spring). 2015 Jun;23(6):1194-200. doi: 10.1002/oby.21083. Epub 2015 May 9. Obesity (Silver Spring). 2015. PMID: 25958858 Free PMC article.
-
The GPCR, class C, group 6, subtype A (GPRC6A) receptor: from cloning to physiological function.Br J Pharmacol. 2014 Mar;171(5):1129-41. doi: 10.1111/bph.12365. Br J Pharmacol. 2014. PMID: 24032653 Free PMC article. Review.
-
GPRC6A is a Potential Therapeutic Target for Metformin Regulation of Glucose Homeostasis in Mice.bioRxiv [Preprint]. 2024 Aug 19:2024.08.19.608635. doi: 10.1101/2024.08.19.608635. bioRxiv. 2024. PMID: 39229180 Free PMC article. Preprint.
-
Discovery of Human Signaling Systems: Pairing Peptides to G Protein-Coupled Receptors.Cell. 2019 Oct 31;179(4):895-908.e21. doi: 10.1016/j.cell.2019.10.010. Cell. 2019. PMID: 31675498 Free PMC article.
-
Undercarboxylated, But Not Carboxylated, Osteocalcin Suppresses TNF-α-Induced Inflammatory Signaling Pathway in Myoblasts.J Endocr Soc. 2022 May 29;6(8):bvac084. doi: 10.1210/jendso/bvac084. eCollection 2022 Aug 1. J Endocr Soc. 2022. PMID: 35702666 Free PMC article.
References
-
- Bräuner-Osborne H, Wellendorph P, Jensen AA. (2007) Structure, pharmacology and therapeutic prospects of family C G-protein coupled receptors. Curr Drug Targets 8:169–184. - PubMed
-
- Chahine M, Bennett PB, George AL, Jr, Horn R. (1994) Functional expression and properties of the human skeletal muscle sodium channel. Pflugers Arch 427:136–142. - PubMed
-
- Christiansen B, Wellendorph P, Bräuner-Osborne H. (2006) Activity of L-alpha-amino acids at the promiscuous goldfish odorant receptor 5.24. Eur J Pharmacol 536:98–101. - PubMed
-
- Clemmensen C, Pehmøller C, Klein AB, Ratner C, Wojtaszewski JFP, Bräuner-Osborne H. (2013a) Enhanced voluntary wheel running in GPRC6A receptor knockout mice. Physiol Behav 118:144–151. - PubMed
Publication types
MeSH terms
Substances
Grants and funding
LinkOut - more resources
Full Text Sources
Other Literature Sources
Molecular Biology Databases
