. 2013 Oct;16(10):1401-8.
doi: 10.1038/nn.3505. Epub 2013 Sep 1.

Act1 mediates IL-17-induced EAE pathogenesis selectively in NG2+ glial cells

Affiliations

Act1 mediates IL-17-induced EAE pathogenesis selectively in NG2+ glial cells

Zizhen Kang et al. Nat Neurosci. 2013 Oct.

Abstract

Interleukin 17 (IL-17) is a signature cytokine of Th17 cells. We previously reported that deletion of NF-κB activator 1 (Act1), the key transducer of IL-17 receptor signaling, from the neuroectodermal lineage in mice (neurons, oligodendrocytes and astrocytes) results in attenuated severity of experimental autoimmune encephalomyelitis (EAE). Here we examined the cellular basis of this observation. EAE disease course was unaffected by deletion of Act1 in neurons or mature oligodendrocytes, and Act1 deletion in astrocytes only modestly affected disease course. Deletion of Act1 in NG2(+) glia resulted in markedly reduced EAE severity. Furthermore, IL-17 induced characteristic inflammatory mediator expression in NG2(+) glial cells. IL-17 also exhibited strong inhibitory effects on the maturation of oligodendrocyte lineage cells in vitro and reduced their survival. These data identify NG2(+) glia as the major CNS cellular target of IL-17 in EAE. The sensitivity of oligodendrocyte lineage cells to IL-17-mediated toxicity further suggests a direct link between inflammation and neurodegeneration in multiple sclerosis.


Figures
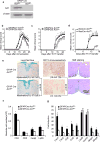
Figure 1
Figure 1
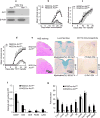
Ablation of Act1 in astrocytes ameliorates autoimmune encephalomyelitis. (a) Immunoblot analysis for the Act1 expression in cultured astrocytes from neonatal GFAPCreAct1fl/− and control GFAPCreAct1fl/+ mice. Full-length blots are presented in Supplementary Figue 5. (b) Mean clinical score of EAE in GFAPCreAct1fl/− and GFAPCreAct1fl/+ mice induced by active immunization with MOG35–55. (c) Mean clinical score of EAE in GFAPCreAct1fl/− and GFAPCreAct1fl/+ mice induced by Th17 adoptive transfer. (d) Mean clinical score of EAE in NesCreAct1fl/− and NesCreAct1fl/+ mice induced by Th17 adoptive transfer (p<0.05, two-way ANOVA). (e) Luxol fast blue, anti-CD11b and H&E staining of lumber spinal cords of GFAPCreAct1fl/− and GFAPCreAct1fl/+ mice 20 days after Th17 adoptive transfer. Data are representative of 5 mice per group. (f) Absolute cell numbers of infiltrated immune cells in the brains of GFAPCreAct1fl/− and GFAPCreAct1fl/+ mice (20 days after Th17 cell transfer. (g) Real-time PCR analysis of inflammatory gene expression in spinal cords of GFAPCreAct1fl/− and GFAPCreAct1fl/+ mice 20 days after Th17 adoptive transfer. Data are representative of three independent experiments. n=5/group in each experiment. Error bars, SEM; *, p<0.05.
Figure 2
Figure 2
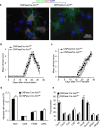
Neuronal Act1 is dispensable for EAE development. (a) Immunoblot analysis for the Act1 expression in cultured neuronal cells from embryonic brains (E14) of neuron-specific Act1-deficient (Enolase2CreAct1fl/−) and control mice (Enolase2CreAct1fl/+). Full-length blots are presented in Supplementary Figure 5. (b) Mean clinical score of EAE in Enolase2CreAct1fl/− and Enolase2CreAct1fl/+ mice induced by active immunization with MOG35–55. (c) Mean clinical score of EAE in the Enolase2CreAct1fl/− and Enolase2CreAct1fl/+ mice induced by MOG35–55-specific Th17 cells. (d) Flow cytometric analysis of immune cell infiltration in the brains of Th17-induced Enolase2CreAct1fl/− and Enolase2CreAct1fl/+ EAE mice (7 days after disease onset). (e) Real-time PCR analysis of inflammatory gene expression in spinal cords of Enolase2CreAct1fl/− and Enolase2CreAct1fl/+ mice transferred with MOG35–55-specific Th17 cells. Data are representative of three independent experiments, n=5/group in each experiment. Error bars, SEM. P>0.05 at b–e.
Figure 3
Figure 3
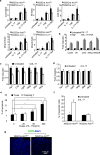
Ablation of Act1 in oligodendrocyte lineage ameliorates autoimmune encephalomyelitis. (a) Immunoblot analysis for the Act1 expression in cultured NG2+ OPCs from embryonic brains. Full-length blots are presented in Supplementary Figure 5. (b) Mean clinical score of EAE in NG2CreAct1fl/− and NG2CreAct1fl/+ mice induced by active immunization with MOG35–55(p<0.05, two-way ANOVA). (c) Mean clinical score of EAE in NG2CreAct1fl/− and NG2CreAct1fl/+ mice induced by Th1 adoptive transfer (p>0.05, two-way ANOVA). (d) Mean clinical score of EAE in NG2CreAct1fl/− and NG2CreAct1fl/+ mice induced by Th17 adoptive transfer (p<0.05, two-way ANOVA). (e) H&E, Luxol fast blue, anti-CD11b staining of lumber spinal cords of NG2CreAct1fl/− and NG2CreAct1fl/+ mice 20 days after Th17 adoptive transfer. Data are representative of 5 mice per group. (f) Absolute cell numbers of infiltrated immune cells in the brains of NG2CreAct1fl/− and NG2CreAct1fl/+ mice (20 days after Th17 cell transfer). (g) Real-time PCR analysis of inflammatory gene expression in spinal cords of NG2CreAct1fl/− and NG2CreAct1fl/+ mice transferred with MOG35–55-specific Th17 cells. Data are representative of three independent experiments. n=5/group in each experiment. Error bars, SEM; *, p<0.05.
Figure 4
Figure 4
Act1 in mature oligodendrocytes is dispensible for the pathogenesis of EAE. (a) Co-staining of Act1 (Red) and CNPase (Green) in cultured oligodendrocytes from CNPaseCreAct1fl/− and control mice (CNPaseCreAct1fl/+). (b) Mean clinical score of EAE in CNPaseCreAct1fl/− and CNPaseCreAct1fl/+ mice induced by active immunization with MOG35–55. (c) Mean clinical score of EAE in the CNPaseCre Act1fl/− and CNPaseCre Act1fl/+ mice induced by MOG35–55-specific Th17 cells. (d) Absolute number of immune cell infiltration in the brains of Th17-induced CNPaseCreAct1fl/− and CNPaseCreAct1fl/+ EAE mice (20 days after Th17 transfer). (e) Real-time PCR analysis of inflammatory gene expression in spinal cords of CNPaseCreAct1fl/− and CNPaseCreAct1fl/+ mice transferred with MOG35–55-specific Th17 cells. Data are representative of three independent experiments. n=5/group in each experiment. Error bars, SEM. P>0.05 at b–e.
Figure 5
Figure 5
Cytotoxic and inflammatory effects of IL-17-induced Act1-mediated signaling on oligodendroglia. After 4-day differentiation culture of neural stem cells with cytokine cocktail of FGF+PDGF, >98% of cells became Olig2+CNPase suggesting they are OPCs. Then cytokines were withdrawn to drive the maturation of OPC for 2 days, immunohistochemical staining suggested that >95% cells were CNPase+ GFAP β-tubulin-III suggesting they are mature oligodendrocytes. (a). OPCs from NG2CreAct1fl/+ and NG2CreAct1fl/− mice were treated with IL-17(25ng/ml), TNF(10ng/ml) or IL-17+TNF for 6 hours. Indicated gene expression was quantified by realtime PCR; (b). Mature oligodendrocytes from wild-type mice were treated with IL-17(25ng/ml), TNF(10ng/ml) or IL-17+TNF for 6 hours. Indicated gene expression was quantified by real-time PCR; (c–d). OPCs from NG2CreAct1fl/+ mice(c) and NG2Cre Act1fl/− mice(d) were cultured for another two days without FGF and PDGF, but with or without addition of IL-17(25ng/ml). Myelin-related gene expression was quantified by realtime PCR. (e). TUNEL and cleaved caspase 3 assays for apoptotic cells after 4 day cultures of wild-type OPCs with/without of IL-17 as indicated. 1500 cells were scored from 15 power field of 5 slices from 5 mice. (F). Data shown are the apoptotic percentages of OPCs from NG2Cre Act1fl/+ mice and NG2Cre Act1fl/− mice after 4 days culture with or without IL-17(200ng/mL). (g). TUNEL assay of apoptotic cells in the lumber spinal cord of NG2CreAct1fl/+ and NG2CreAct1fl/− mice 20 days after Th17 adoptive transfer. Apoptotic cells were counted from five sections of each mouse and then got the mean value per section. Data are representative of three independent experiments. n=5/group in each experiment. Error bars, SEM; *, p<0.05.
Figure 6
Figure 6
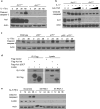
IL-17 induces cell apoptosis in an Act1 and FADD-dependent pathway. (a) Immunoassay of Act1+/+ or Act1−/− MEFs treated with IL-17 (50ng/ml) for the indicated times. Cells lysates were ran on SDS-PAGE gel and then probed for cleavaged caspase 3, Act1 and β-Actin. (b) MEFs treated with IL-17(50ng/ml) plus increasing amounts of anti-TNF-α neutralizing antibodies (1, 5, 10μg/ml). (c) Immunoblot analysis of wild type, p55-deficient, p75-deficient, p55 and p75 double-deficient kidney epithelial cells treated with IL-17 (200ng/ml) for the indicated times. (d) HEK293 cells were transfected with Flag-tagged vector as control, Flag -Act1 and – FADD. Lysates were immunoprecipitated with anti-Flag. (e) Immunoassay of OPCs transduced with lentivirus-expressing scrambled shRNA, or FADD-targeting shRNA1 or shRNA2. Cells were untreated or treated with IL-17 (200ng/ml). Cell lysates were blotted as indicated. Data are representative of at least three independent experiments. Full-length blots are presented in Supplementary Figure 6.

Similar articles

Cited by

References

    1. Sawcer S, et al. Genetic risk and a primary role for cell-mediated immune mechanisms in multiple sclerosis. Nature. 2011;476:214–219. - PMC - PubMed
    1. Becher B, Bechmann I, Greter M. Antigen presentation in autoimmunity and CNS inflammation: how T lymphocytes recognize the brain. J Mol Med (Berl) 2006;84:532–543. - PubMed
    1. Sospedra M, Martin R. Immunology of multiple sclerosis. Annu Rev Immunol. 2005;23:683–747. - PubMed
    1. Steinman L. Multiple sclerosis: a two-stage disease. Nat Immunol. 2001;2:762–764. - PubMed
    1. Ransohoff RM. Animal models of multiple sclerosis: the good, the bad and the bottom line. Nat Neurosci. 2012;15:1074–1077. - PMC - PubMed

Publication types

MeSH terms

Substances

LinkOut - more resources