

Inferring viral population structures using heteroduplex mobility and DNA sequence analyses
- PMID: 23994080
- PMCID: PMC3825756
- DOI: 10.1016/j.jviromet.2013.08.012
Inferring viral population structures using heteroduplex mobility and DNA sequence analyses
Abstract
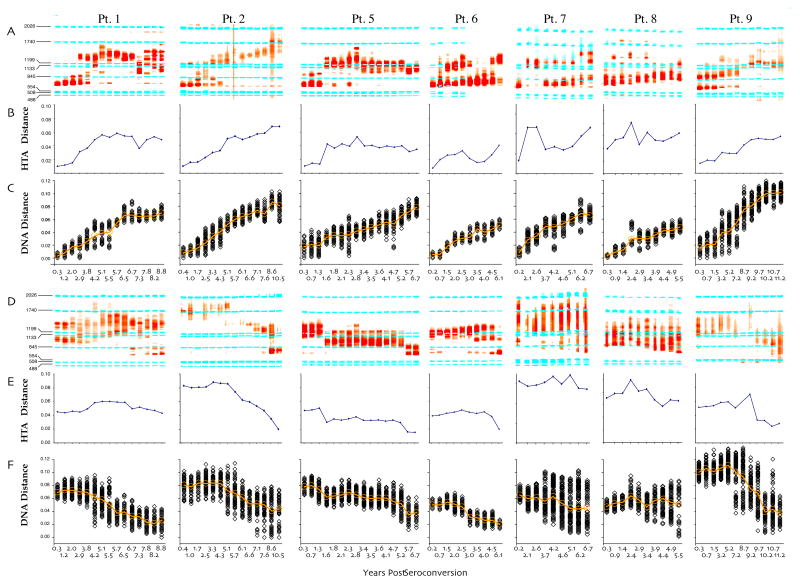
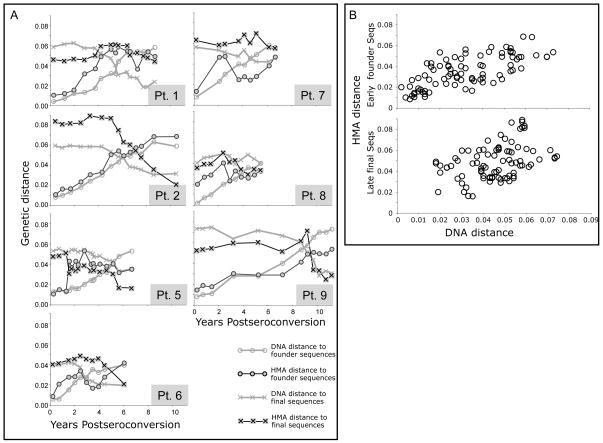
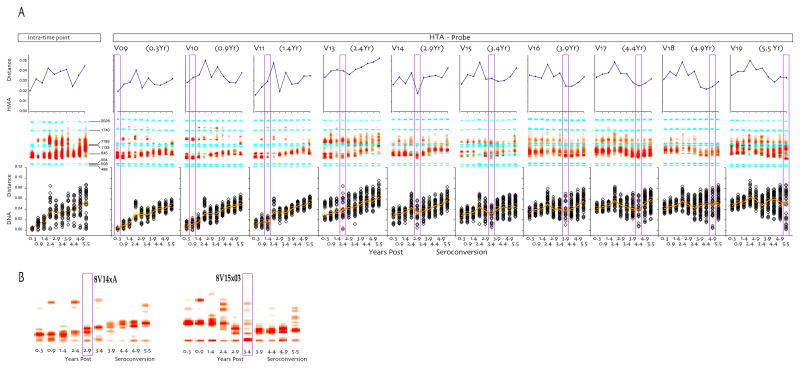
Heteroduplex mobility (HMA) and tracking assays (HTA) are used to assess genetic relationships between DNA molecules. While distinguishing relationships between clonal or nearly clonal molecules is relatively straightforward, inferring population structures is more complex. To address this issue, HIV-1 quasispecies with varying levels of diversity were studied using both HTA and DNA sequencing. Viral diversity estimates and the temporal features of virus evolution were found to be generally concordant between HTA and DNA sequencing. In addition, the distribution of pairwise differences and the rates of virus divergence were similar between the two methods. These findings support the use of HTA to characterize variant populations of DNA and strengthen previous inferences concerning the evolution of HIV-1 over the course of infection.
Keywords: DNA sequencing; HIV-1; Heteroduplex mobility assay; Heteroduplex tracking assay; Viral diversity; Viral evolution.
Copyright © 2013 Elsevier B.V. All rights reserved.
Figures
Similar articles
-
A gp41-based heteroduplex mobility assay provides rapid and accurate assessment of intrasubtype epidemiological linkage in HIV type 1 heterosexual transmission Pairs.AIDS Res Hum Retroviruses. 2012 Dec;28(12):1745-55. doi: 10.1089/AID.2012.0023. Epub 2012 Jul 3. AIDS Res Hum Retroviruses. 2012. PMID: 22587371 Free PMC article.
-
Sequencing-based detection of low-frequency human immunodeficiency virus type 1 drug-resistant mutants by an RNA/DNA heteroduplex generator-tracking assay.J Virol. 2004 Jul;78(13):7112-23. doi: 10.1128/JVI.78.13.7112-7123.2004. J Virol. 2004. PMID: 15194787 Free PMC article.
-
A novel denaturing heteroduplex tracking assay for genotypic prediction of HIV-1 tropism.J Virol Methods. 2012 Oct;185(1):108-17. doi: 10.1016/j.jviromet.2012.06.013. Epub 2012 Jun 21. J Virol Methods. 2012. PMID: 22728273 Free PMC article.
-
Viral genome characterisation by the heteroduplex mobility and heteroduplex tracking assays.Rev Med Virol. 2000 Sep-Oct;10(5):321-35. doi: 10.1002/1099-1654(200009/10)10:5<321::aid-rmv288>3.0.co;2-x. Rev Med Virol. 2000. PMID: 11015743 Review.
-
Within-host nucleotide diversity of virus populations: insights from next-generation sequencing.Infect Genet Evol. 2015 Mar;30:1-7. doi: 10.1016/j.meegid.2014.11.026. Epub 2014 Dec 4. Infect Genet Evol. 2015. PMID: 25481279 Free PMC article. Review.
References
-
- Abraha A, Troyer RM, Quinones-Mateu ME, Arts EJ. Methods to determine HIV-1 ex vivo fitness. Methods in molecular biology. 2005;304:355–68. - PubMed
-
- Agwale SM, Robbins KE, Odama L, Saekhou A, Zeh C, Edubio A, Njoku OM, Sani-Gwarzo N, Gboun MF, Gao F, Reitz M, Hone D, Folks TM, Pieniazek D, Wambebe C, Kalish ML. Development of an env gp41-based heteroduplex mobility assay for rapid human immunodeficiency virus type 1 subtyping. J Clin Microbiol. 2001;39:2110–4. - PMC - PubMed
-
- Apetrei C, Collin G, Diculencu D, Ajaka IL, Farfara I, Panzaru C, Coman G, Duca M, Brun-Vezinet F, Simon F. The isolation and subtyping of the human immunodeficiency virus (HIV) from children in Moldova. The evidence for subtype F. Revista medico-chirurgicala a Societatii de Medici si Naturalisti din Iasi. 1995;99:124–8. - PubMed
-
- Avila MM, Pando MA, Carrion G, Peralta LM, Salomon H, Carrillo MG, Sanchez J, Maulen S, Hierholzer J, Marinello M, Negrete M, Russell KL, Carr JK. Two HIV-1 epidemics in Argentina: different genetic subtypes associated with different risk groups. J Acquir Immune Defic Syndr. 2002;29:422–6. - PubMed
-
- Bachmann MH, Delwart EL, Shpaer EG, Lingenfelter P, Singal R, Mullins JI. Rapid genetic characterization of HIV type 1 strains from four World Health Organization-sponsored vaccine evaluation sites using a heteroduplex mobility assay. WHO Network for HIV Isolation and Characterization AIDS research and human retroviruses. 1994;10:1345–53. - PubMed
Publication types
MeSH terms
Grants and funding
LinkOut - more resources
Full Text Sources
Other Literature Sources
