

Mesenchymal stromal-cell transplants induce oligodendrocyte progenitor migration and remyelination in a chronic demyelination model
- PMID: 23990019
- PMCID: PMC3763464
- DOI: 10.1038/cddis.2013.304
Mesenchymal stromal-cell transplants induce oligodendrocyte progenitor migration and remyelination in a chronic demyelination model
Abstract
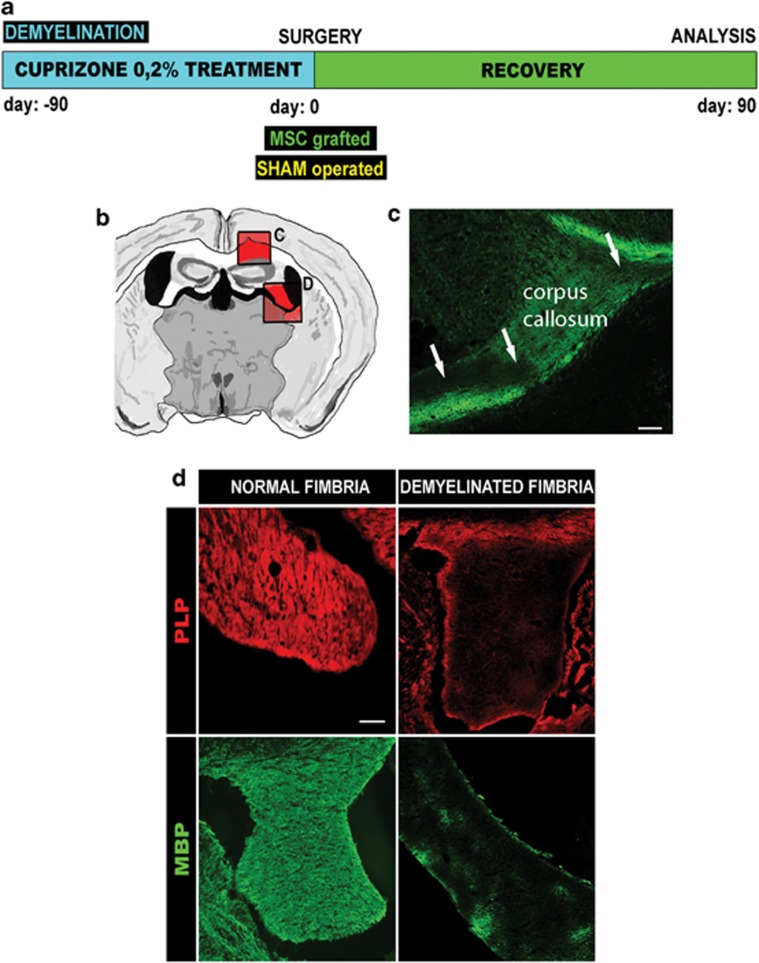
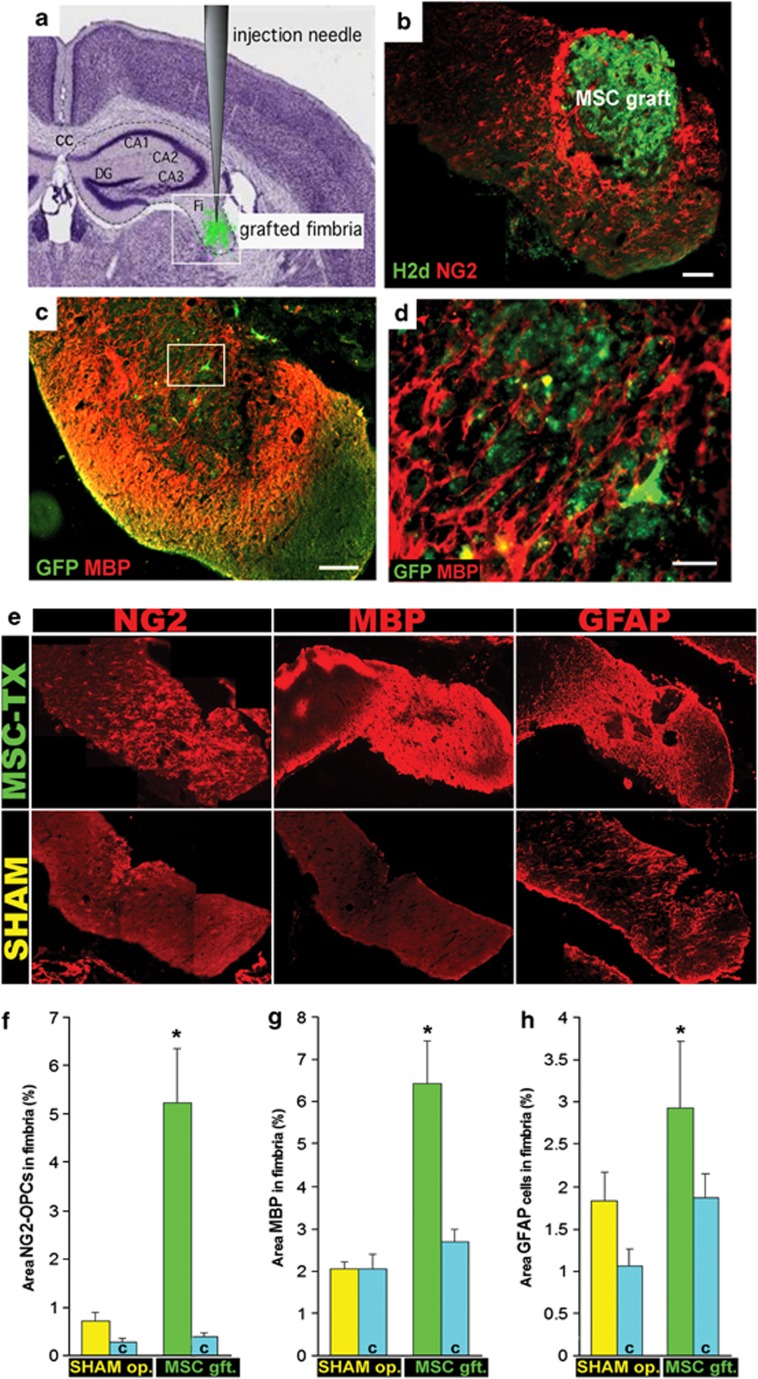
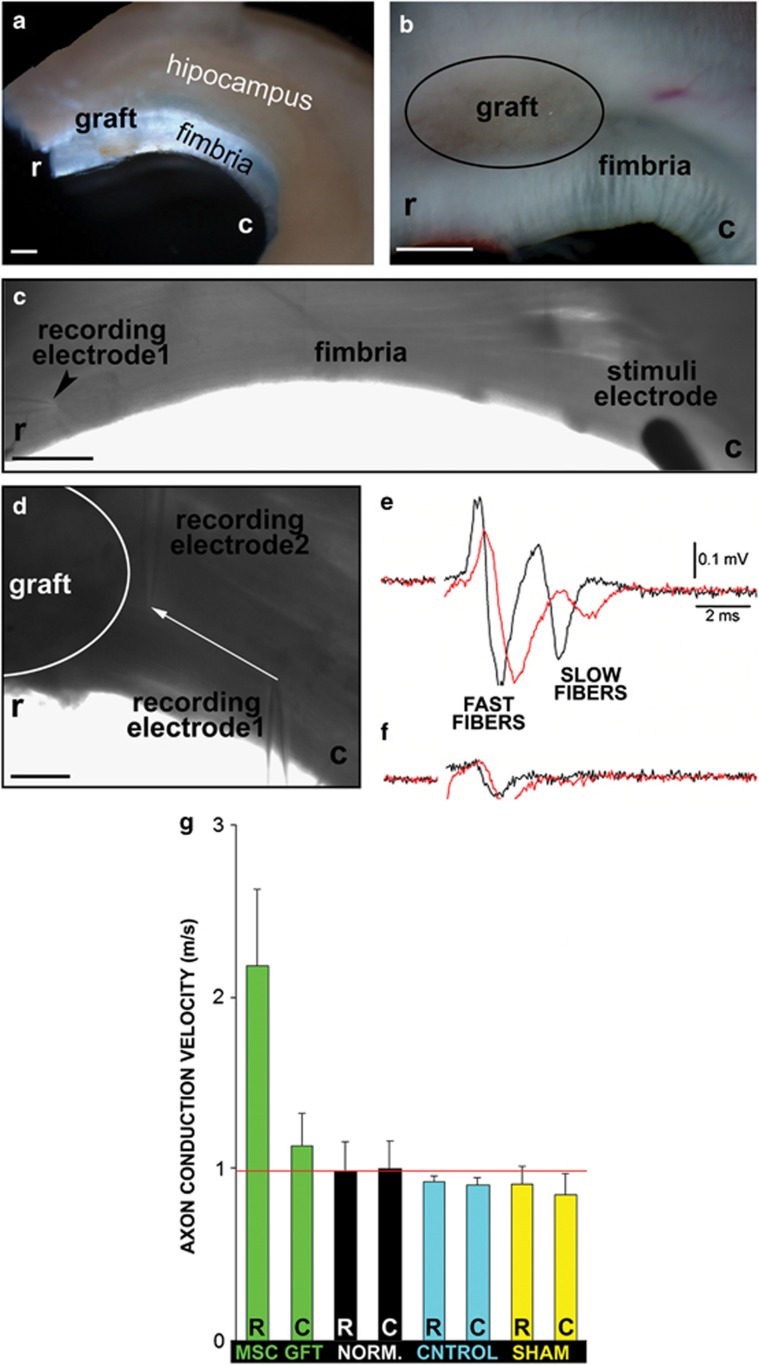
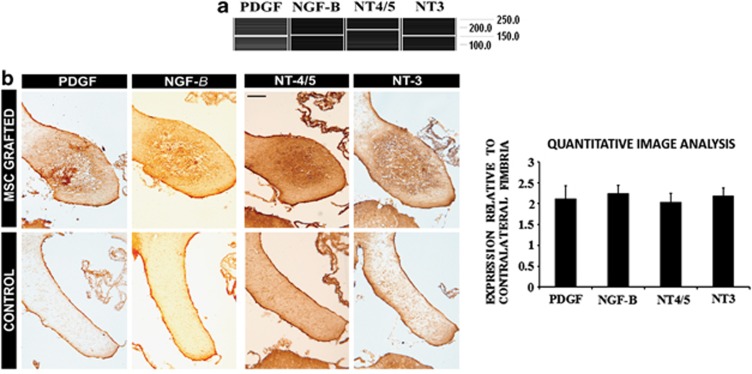
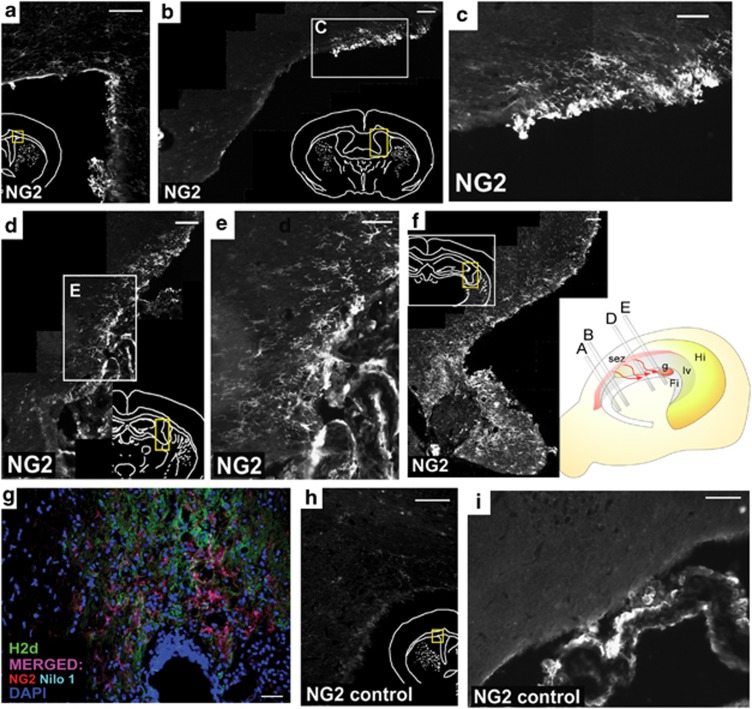
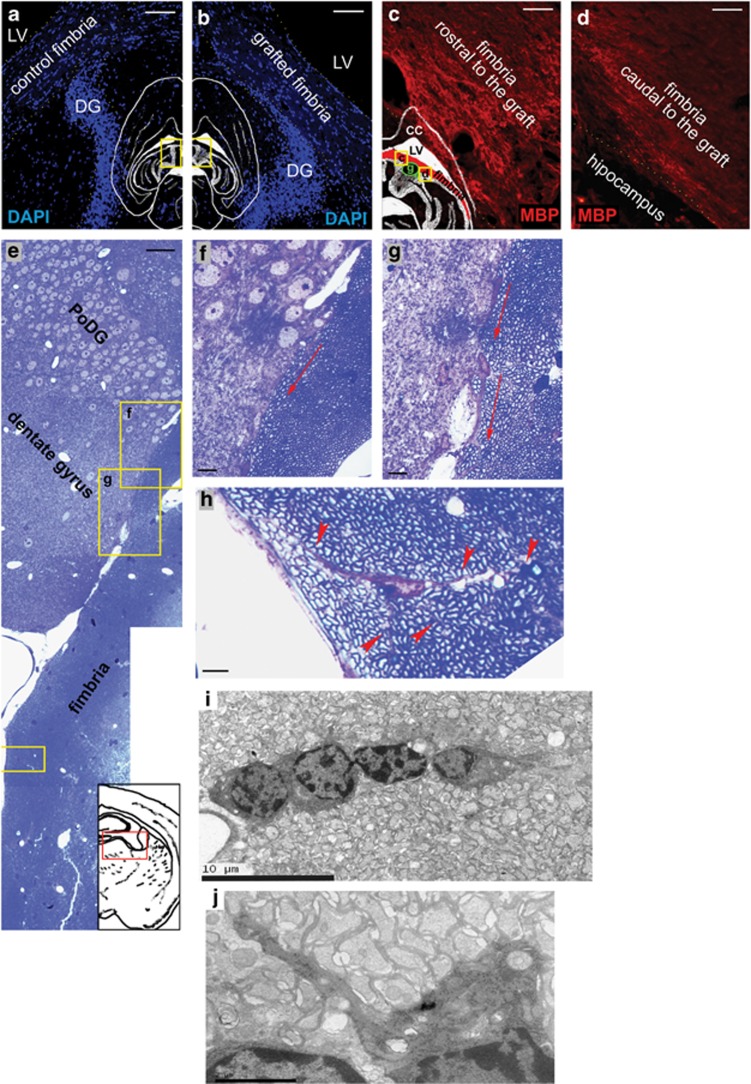
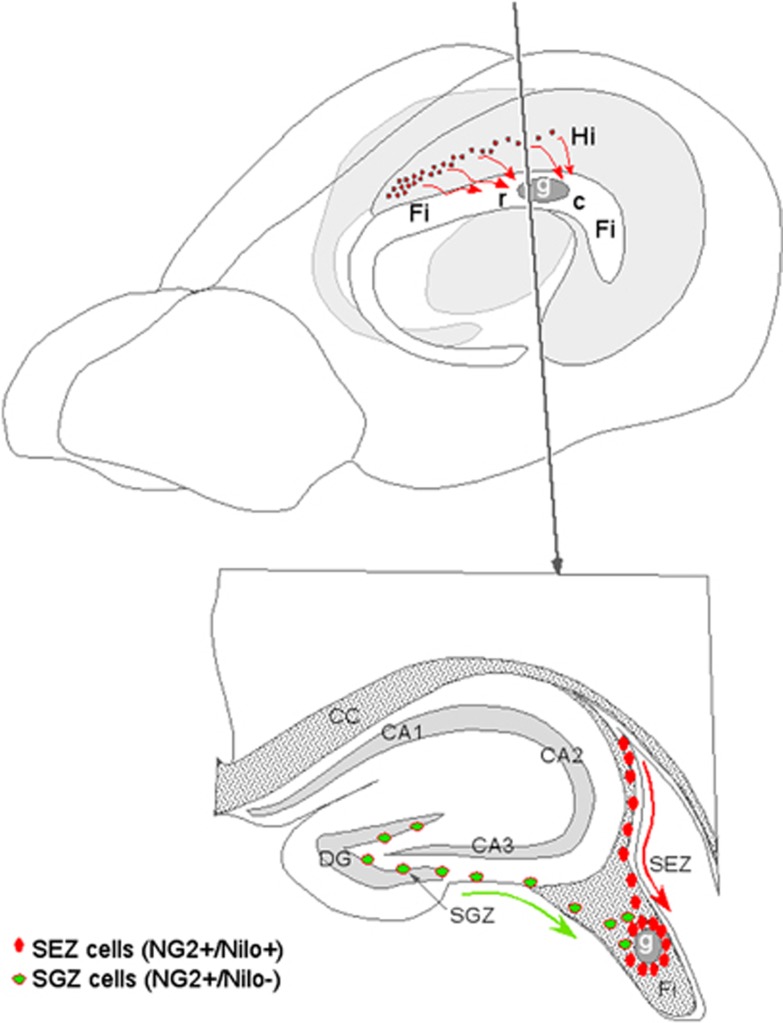
Demyelinating disorders such as leukodystrophies and multiple sclerosis are neurodegenerative diseases characterized by the progressive loss of myelin that may lead toward a chronic demyelination of the brain's white matter, impairing normal axonal conduction velocity and ultimately causing neurodegeneration. Current treatments modifying the pathological mechanisms are capable of ameliorating the disease; however, frequently, these therapies are not sufficient to repress the progressive demyelination into a chronic condition and permanent loss of function. To this end, we analyzed the effect that bone marrow-derived mesenchymal stromal cell (BM-MSC) grafts exert in a chronically demyelinated mouse brain. As a result, oligodendrocyte progenitors were recruited surrounding the graft due to the expression of various trophic signals by the grafted MSCs. Although there was no significant reaction in the non-grafted side, in the grafted regions oligodendrocyte progenitors were detected. These progenitors were derived from the nearby tissue as well as from the neurogenic niches, including the subependymal zone and dentate gyrus. Once near the graft site, the cells matured to myelinating oligodendrocytes. Finally, electrophysiological studies demonstrated that axonal conduction velocity was significantly increased in the grafted side of the fimbria. In conclusion, we demonstrate here that in chronic demyelinated white matter, BM-MSC transplantation activates oligodendrocyte progenitors and induces remyelination in the tissue surrounding the stem cell graft.
Figures
Similar articles
-
Intraventricular injections of mesenchymal stem cells activate endogenous functional remyelination in a chronic demyelinating murine model.Cell Death Dis. 2016 May 12;7(5):e2223. doi: 10.1038/cddis.2016.130. Cell Death Dis. 2016. PMID: 27171265 Free PMC article.
-
Neural Stem Cells of the Subventricular Zone Contribute to Neuroprotection of the Corpus Callosum after Cuprizone-Induced Demyelination.J Neurosci. 2019 Jul 10;39(28):5481-5492. doi: 10.1523/JNEUROSCI.0227-18.2019. Epub 2019 May 28. J Neurosci. 2019. PMID: 31138656 Free PMC article.
-
The comparative effects of bone marrow mesenchymal stem cells and supernatant transplantation on demyelination and inflammation in cuprizone model.Mol Biol Rep. 2024 May 24;51(1):674. doi: 10.1007/s11033-024-09628-w. Mol Biol Rep. 2024. PMID: 38787497
-
The role of oligodendrocytes and oligodendrocyte progenitors in CNS remyelination.Adv Exp Med Biol. 1999;468:183-97. doi: 10.1007/978-1-4615-4685-6_15. Adv Exp Med Biol. 1999. PMID: 10635029 Review.
-
Matrix metalloproteinases shape the oligodendrocyte (niche) during development and upon demyelination.Neurosci Lett. 2020 Jun 11;729:134980. doi: 10.1016/j.neulet.2020.134980. Epub 2020 Apr 19. Neurosci Lett. 2020. PMID: 32315713 Review.
Cited by
-
Neocortical tissue recovery in severe congenital obstructive hydrocephalus after intraventricular administration of bone marrow-derived mesenchymal stem cells.Stem Cell Res Ther. 2020 Mar 17;11(1):121. doi: 10.1186/s13287-020-01626-6. Stem Cell Res Ther. 2020. PMID: 32183876 Free PMC article.
-
Restrained Th17 response and myeloid cell infiltration into the central nervous system by human decidua-derived mesenchymal stem cells during experimental autoimmune encephalomyelitis.Stem Cell Res Ther. 2016 Mar 17;7:43. doi: 10.1186/s13287-016-0304-5. Stem Cell Res Ther. 2016. PMID: 26987803 Free PMC article.
-
Dose Effect of Mesenchymal Stromal Cell Delivery Through Cardiopulmonary Bypass.Ann Thorac Surg. 2023 Dec;116(6):1337-1345. doi: 10.1016/j.athoracsur.2022.07.035. Epub 2022 Aug 8. Ann Thorac Surg. 2023. PMID: 35952858 Free PMC article.
-
Effect of Multiple Intraperitoneal Injections of Human Bone Marrow Mesenchymal Stem Cells on Cuprizone Model of Multiple Sclerosis.Iran Biomed J. 2018 Sep;22(5):312-21. doi: 10.29252/ibj.22.5.312. Epub 2018 Feb 7. Iran Biomed J. 2018. PMID: 29409311 Free PMC article.
-
Therapeutic Aspects of Mesenchymal Stem Cell-Based Cell Therapy with a Focus on Human Amniotic Epithelial Cells in Multiple Sclerosis: A Mechanistic Review.Int J Stem Cells. 2021 Aug 30;14(3):241-251. doi: 10.15283/ijsc21032. Int J Stem Cells. 2021. PMID: 34158417 Free PMC article. Review.
References
-
- Steinman L. Multiple sclerosis: a coordinated immunological attack against myelin in the central nervous system. Cell. 1996;85:299–302. - PubMed
-
- Aktas O, Kieseier B, Hartung HP. Neuroprotection, regeneration and immunomodulation: broadening the therapeutic repertoire in multiple sclerosis. Trends Neurosci. 2010;33:140–152. - PubMed
-
- Kohler W. Leukodystrophies with late disease onset: an update. Curr Opin Neurol. 2010;23:234–241. - PubMed
-
- Nave KA. Myelination and support of axonal integrity by glia. Nature. 2010;468:244–252. - PubMed
-
- Nishiyama A, Komitova M, Suzuki R, Zhu X. Polydendrocytes (NG2 cells): multifunctional cells with lineage plasticity. Nat Rev Neurosci. 2009;10:9–22. - PubMed
Publication types
MeSH terms
Substances
LinkOut - more resources
Full Text Sources
Other Literature Sources
Research Materials
