. 2013 Nov 15;126(Pt 22):5271-83.
doi: 10.1242/jcs.133678. Epub 2013 Aug 28.

Centromeric motion facilitates the mobility of interphase genomic regions in fission yeast

Affiliations

Centromeric motion facilitates the mobility of interphase genomic regions in fission yeast

Kyoung-Dong Kim et al. J Cell Sci. .

Abstract

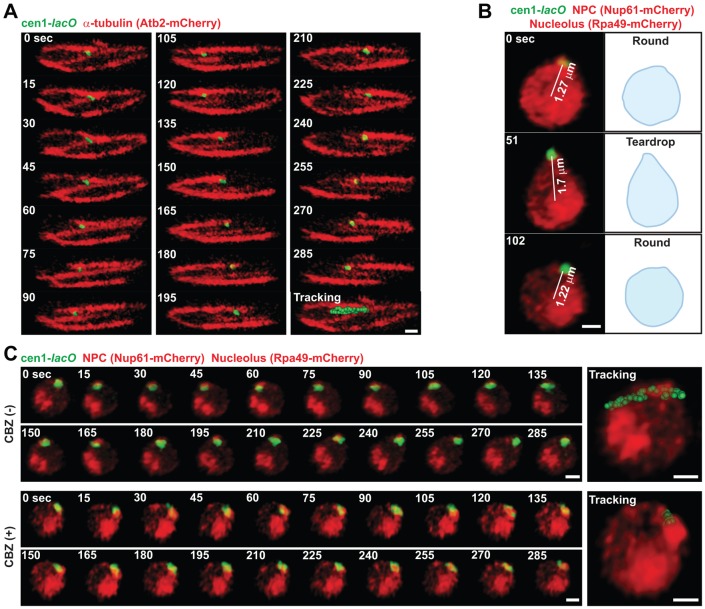
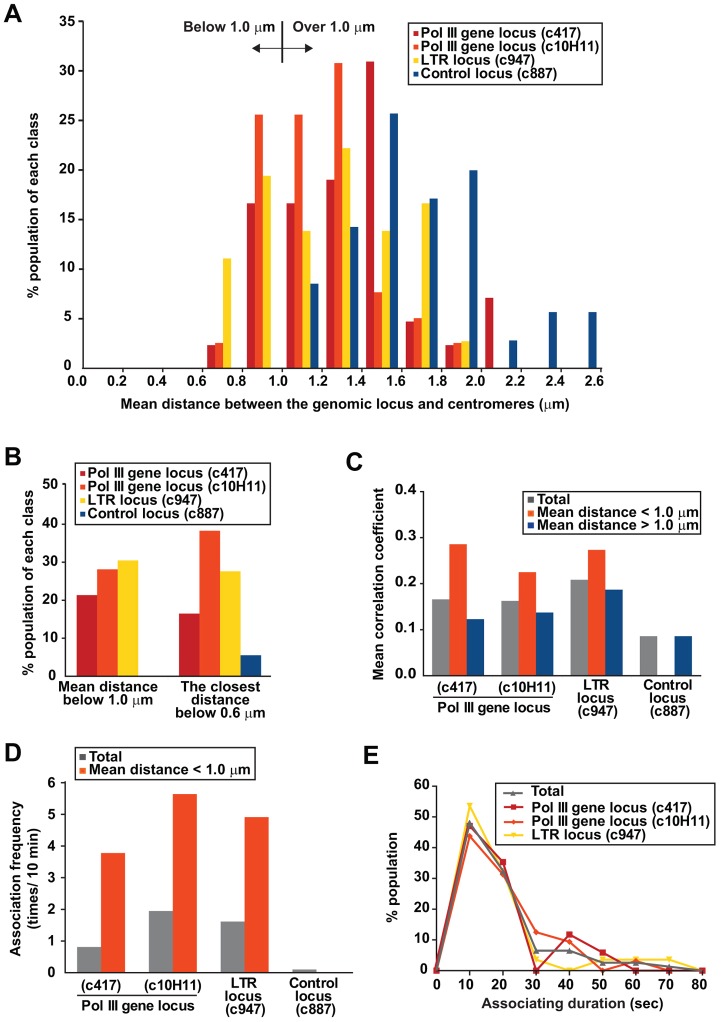
Dispersed genetic elements, such as retrotransposons and Pol-III-transcribed genes, including tRNA and 5S rRNA, cluster and associate with centromeres in fission yeast through the function of condensin. However, the dynamics of these condensin-mediated genomic associations remains unknown. We have examined the 3D motions of genomic loci including the centromere, telomere, rDNA repeat locus, and the loci carrying Pol-III-transcribed genes or long-terminal repeat (LTR) retrotransposons in live cells at as short as 1.5-second intervals. Treatment with carbendazim (CBZ), a microtubule-destabilizing agent, not only prevents centromeric motion, but also reduces the mobility of the other genomic loci during interphase. Further analyses demonstrate that condensin-mediated associations between centromeres and the genomic loci are clonal, infrequent and transient. However, when associated, centromeres and the genomic loci migrate together in a coordinated fashion. In addition, a condensin mutation that disrupts associations between centromeres and the genomic loci results in a concomitant decrease in the mobility of the loci. Our study suggests that highly mobile centromeres pulled by microtubules in cytoplasm serve as 'genome mobility elements' by facilitating physical relocations of associating genomic regions.

Keywords: Condensin; Fission yeast; Genome dynamics; Live-cell imaging; Nuclear organization.


Figures

Fig. 1.
Fig. 1.
Centromeric motion coupled to microtubule polymerization in cytoplasm. (A) Selected frames from a time-lapse series of the live fission yeast cell showing microtubules (red) and the centromere (cen1-lacO, green). Microtubules were visualized by mCherry fused to Atb2 (α-tubulin). Tracking of the cen1 locus is shown at the end of the time-lapse sequence. (B) Nuclear morphology and centromeric position. The centromere (cen1-lacO, green), the NPC (Nup61–mCherry, red) and the nucleolus (Rpa49–mCherry, red) were visualized in live cells. Selected frames from a time-lapse series and 3D distances between the nuclear centers and centromeric foci are shown (left). A schematic of the nuclear morphology is depicted next to the microscopic images. (C) CBZ treatment affects centromeric mobility. Cells were treated with 50 µg/ml CBZ in EMM liquid medium for 15 minutes and applied to microscopic slides with a mounting medium containing CBZ. Images were captured in 3D at 3.0-second intervals for 5 minutes. Scale bars: 1 µm.
Fig. 2.
Fig. 2.
Moving volume analysis for the genomic loci in several culturing conditions. (A) Estimation of the moving volume of the genomic locus. This schematic illustrates how occupancy of the genomic locus was estimated based on 3D time-lapse images. The moving volume of the genomic locus was defined as an accumulated number of cubes. See the Materials and Methods for details. (B) Moving volume analysis for the centromere (cen1). Cells were treated with 50 µg/ml CBZ, 40 mM CCCP or 15 mM NaN3 in liquid EMM for 15 minutes and applied to microscopic slides. The centromere (cen1-lacO, green), the NPC (Nup61–mCherry, red) and the nucleolus (Rpa49–mCherry, red) were co-visualized in live cells, and tracking of the centromere is shown (left). Images were captured in 3D at 3.0-second intervals for 5 minutes. The position of the centromere was normalized to the center of the nucleus. The moving volume of the centromere was estimated by counting the cubes (middle). The moving volume of the centromere was analyzed in five cells and data are represented as mean ± s.d. (right). (C) Moving volume analyses for the centromere (cen2), the Pol III gene loci (c417 and c10H11), the LTR retrotransposon locus (c947), the tel2R telomere locus and the control locus (c887). Typical tracking images are shown as insets. Scale bars: 1 µm.
Fig. 3.
Fig. 3.
Coordinated migration between centromeres and their associating genomic loci. (A) The genomic locus (green), either the Pol III gene locus (c417, top) or the control locus (c887, bottom), was co-visualized with centromeres (Mis12–mCherry, red). Images were captured in 3D at 3.0-second intervals for 5 minutes and selected frames are shown. (B) Distances between centromeres and the genomic loci (c417 and c887) were measured in 3D time-lapse images used in A and plotted against time. Distances below 0.6 µm and between 0.6 and 0.9 µm are highlighted with different colors. (C) Distances between centromeres and the genomic loci, such as the Pol III gene locus (c417 and c10H11), the LTR retrotransposon locus (c947) and the control locus (c887) were measured in 3D time-lapse images. Images were captured at 3.0-second intervals for 5 minutes in more than 35 cells, and 10 examples for each locus are shown in a graph. (D) The c417 Pol III gene locus and centromeres show the coordinated movement in the case where two foci transiently migrate within 0.6 µm during the 5-minute investigation. Distances between the Pol III gene locus and centromeres are plotted against time (left). Tracking of the Pol III gene locus (green) and centromeres (red) along the x and y axes is shown (right). Coordinates of the c417 Pol III gene locus and centromeres in the x and y axes were used to calculate Δx and Δy at 3.0-seconds interval. The Δx and Δy values were plotted against time and used to calculate Pearson's correlations (bottom). (E) The coordinated motion between the c417 Pol III gene locus and centromeres. Distances between centromeres and the c417 Pol III gene locus were measured in 3D time-lapse images (n = 42). On the basis of the following criteria, cells were classified into three groups. In 7 and 13 cells, the Pol III gene locus migrated within 0.6 µm and between 0.6 and 0.9 µm from centromeres, respectively, at least once during the 5-minute investigation. In 22 cells, the two foci were always separated more than 0.9 µm. The mean correlation coefficient is calculated for each cell as the mean of Pearson's correlations in the x and y directions. The averages of the mean correlation coefficients in the three cell populations are shown. Scale bars: 1 µm.
Fig. 4.
Fig. 4.
Estimation of the association dynamics between centromeres and the genomic loci. (A) Distributions of mean distances between centromeres and the indicated genomic loci in the cell population. Distances between centromeres and the genomic loci (c417, c10H11, c947, and c887) were measured at 3.0-second intervals for 5 minutes (n = 42, 39, 36 and 35, respectively). The mean distance was calculated for each cell. Distributions of mean distances are plotted in the histogram. (B) Estimation of association frequencies in the cell population. The data in A were used to calculate the percentage of cells in each population in which mean distances between the centromeres and the indicated genomic loci were below 1.0 µm (left) and the genomic loci migrated within 0.6 µm from centromeres at least once during the 5-minute investigation (right). (C) The coordinated motion between centromeres and the genomic loci is enhanced when mean distances between two foci are below 1.0 µm. On the basis of the mean distances shown in A, cells were classified into two groups, in which mean distances between centromeres and the genomic loci were below or above 1.0 µm. The mean correlation coefficient was calculated for every cell, as described in Fig. 3E, and the averages of the mean correlation coefficients in the respective groups are shown. (D) Association frequencies between centromeres and the genomic loci. The number of times that 3D distances between centromeres and the genomic loci fell below 0.6 µm was counted to estimate their potential associations in the entire cell population and in cells where the mean distances between centromeres and the genomic loci were below 1.0 µm. (E) Durations of association between centromeres and the genomic loci were estimated for the potential associations predicted in D, and the distributions of the durations of association are plotted.
Fig. 5.
Fig. 5.
Condensin is involved in the mobility of the genomic loci. (A) Distances between centromeres and the genomic loci, such as the c417 Pol III gene locus and the c887 control locus, were measured in cut3-477 and cut14-208 condensin mutant cells (n>35). Wild-type and cut3-477 cells were cultured at the restrictive (36°C) temperature for 2 hours and subjected to live-cell imaging analysis within a temperature-controlled chamber. The cut14-208 cells were cultured at 36°C for 1 hour. Most cells used for the analyses were in interphase. Images were captured in 3D at 3.0-second intervals for 3 minutes. Distributions of the mean distances are summarized in a graph. (B) The c417 Pol III gene locus and c947 retrotransposon locus tend to localize in the interior domain of the nucleus in the cut3-477 condensin mutant. The genomic loci (lacO, green), the NPC (Nup61–mCherry, red), and the nucleolus (Rpa49–mCherry, red) were co-visualized in wild-type and cut3-477 cells. Images were captured in 3D at 6.0-second intervals for 5 minutes. The distance from the nuclear center was divided into three zones based on the criteria depicted on the left. The mean distance between the nuclear center and the indicated genomic loci was assigned into one of these zones. (C) The moving volumes of the indicated genomic loci were estimated for the wild-type and cut3-477 condensin mutant as described in Fig. 2A. The moving volumes of the respective loci were analyzed in more than 10 cells, and data are represented as mean ± s.d.
Fig. 6.
Fig. 6.
The potential role of centromeres in genome-wide mobility. (A) Comparison between the moving volumes of centromeres and the genomic loci. On the basis of the mean distances shown in Fig. 4A, cells were classified into two groups in which mean distances between centromeres and the genomic loci were below or above 1.0 µm. In individual cells, the moving volumes of centromeres and the genomic loci were estimated as described in Fig. 2A. The moving volumes of centromeres and the genomic loci at the last time-point (5 minutes) are plotted. The dotted circle represents cells with a moving volume of less than 0.4 µm3 for the genomic loci. (B) Representative data showing a 5-minute tracking of centromeres (Mis12–mCherry, red) and the c417 Pol III gene locus (green) in cells with mean distances below (left) and above 1.0 µm (right). Scale bar: 1 µm. (C) A model for the role of centromeric motion in the mobility of other genomic regions. Microtubule polymerization in cytoplasm actively pushes centromeres in nucleoplasm. Centromeres transiently associate with genomic loci carrying Pol III genes and retrotransposons. These associations are mediated by condensin. Centromeres and their associating genomic loci migrate in a coordinated fashion. Because Pol IIl genes and retrotransposons are dispersed throughout the genome, centromeric motion regulated by cytoplasmic microtubules can potentially impact genome-wide mobility.

Similar articles

Cited by

References

    1. Bähler J., Wu J. Q., Longtine M. S., Shah N. G., McKenzie A., 3rd, Steever A. B., Wach A., Philippsen P., Pringle J. R. (1998). Heterologous modules for efficient and versatile PCR-based gene targeting in Schizosaccharomyces pombe. Yeast 14, 943–951 10.1002/(SICI)1097-0061(199807)14:10<943::AID-YEA292>3.0.CO;2-Y - DOI - PubMed
    1. Baker M. (2011). Genomics: Genomes in three dimensions. Nature 470, 289–294 10.1038/470289a - DOI - PubMed
    1. Berger A. B., Cabal G. G., Fabre E., Duong T., Buc H., Nehrbass U., Olivo-Marin J. C., Gadal O., Zimmer C. (2008). High-resolution statistical mapping reveals gene territories in live yeast. Nat. Methods 5, 1031–1037 10.1038/nmeth.1266 - DOI - PubMed
    1. Bowen N. J., Jordan I. K., Epstein J. A., Wood V., Levin H. L. (2003). Retrotransposons and their recognition of pol II promoters: a comprehensive survey of the transposable elements from the complete genome sequence of Schizosaccharomyces pombe. Genome Res. 13, 1984–1997 10.1101/gr.1191603 - DOI - PMC - PubMed
    1. Bystricky K., Laroche T., van Houwe G., Blaszczyk M., Gasser S. M. (2005). Chromosome looping in yeast: telomere pairing and coordinated movement reflect anchoring efficiency and territorial organization. J. Cell Biol. 168, 375–387 10.1083/jcb.200409091 - DOI - PMC - PubMed

Publication types

MeSH terms

LinkOut - more resources