. 2013 Sep;123(9):3848-60.
doi: 10.1172/JCI67399. Epub 2013 Aug 27.

Multi-step inhibition explains HIV-1 protease inhibitor pharmacodynamics and resistance

Affiliations

Multi-step inhibition explains HIV-1 protease inhibitor pharmacodynamics and resistance

S Alireza Rabi et al. J Clin Invest. 2013 Sep.

Abstract

HIV-1 protease inhibitors (PIs) are among the most effective antiretroviral drugs. They are characterized by highly cooperative dose-response curves that are not explained by current pharmacodynamic theory. An unresolved problem affecting the clinical use of PIs is that patients who fail PI-containing regimens often have virus that lacks protease mutations, in apparent violation of fundamental evolutionary theory. Here, we show that these unresolved issues can be explained through analysis of the effects of PIs on distinct steps in the viral life cycle. We found that PIs do not affect virion release from infected cells but block entry, reverse transcription, and post-reverse transcription steps. The overall dose-response curves could be reconstructed by combining the curves for each step using the Bliss independence principle, showing that independent inhibition of multiple distinct steps in the life cycle generates the highly cooperative dose-response curves that make these drugs uniquely effective. Approximately half of the inhibitory potential of PIs is manifest at the entry step, likely reflecting interactions between the uncleaved Gag and the cytoplasmic tail (CT) of the Env protein. Sequence changes in the CT alone, which are ignored in current clinical tests for PI resistance, conferred PI resistance, providing an explanation for PI failure without resistance.


Figures
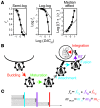
Figure 1
Figure 1. PI pharmacodynamics.
(A) Representations of the dose-response curves for the PI ATV. Primary CD4+ T cells were infected with viruses generated in the presence of various ATV concentrations, and fu was measured as previously described (2). Left panel: conventional semi-log dose-response curve in which fu is plotted against log D (normalized by IC50). Conventional plots obscure the differences between the ATV curve and the curve for a hypothetical drug with the same IC50 and an m value of 1 (dotted line). Middle panel: log-log of the dose-response curve. Right panel: median effect plot, log [(1 – fu)/fu] vs. log D/IC50. This plot, based on Equation 2, linearizes most dose-response curves, resulting in lines whose slopes are equal to the slope parameter m in Equations 1 and 2. This plot illustrates the steep slope and upward inflection of PI dose-response curves. (B) PIs may inhibit multiple steps in the life cycle. PIs block maturation of the virus particle (green arrow). Since maturation begins concomitantly with budding, an effect on budding is possible. Viruses that fail to mature due to the action of PIs could be blocked at downstream steps including entry, reverse transcription, and integration. (C) If PIs block multiple steps, then Bliss independence predicts that the fraction of successful infection events is the product of the fraction of viruses that pass each block. The maximal slope of the overall dose-response curve is the sum of the slopes of the dose-response curves for each step (Supplemental Appendix 1).
Figure 2
Figure 2. log-log dose-response curves illustrating the effects of the PIs ATV, DRV, and LPV on budding and entry.
(A, C, and E) Budding was assessed by quantifying virus particles in the supernatants of cultures of 293T cells transfected with a proviral construct. (B, D, and F) Entry was measured by FRET using BLAM-vpr–loaded pseudoviruses with WT HIV-1 Env (filled circles), HIV-1 Env with a truncated CT (open circles), or VSV-G (triangles). Drug concentrations were normalized by previously measured IC50 values for inhibition of infectivity by each drug (13.6 nM, 23.6 nM, and 35.8 nM for ATV, DRV, and LPV, respectively, ref. 2).
Figure 3
Figure 3. Median effect plots illustrating the effects of the PIs ATV, DRV, and LPV on HIV-1 entry, reverse transcription, all postentry events, and overall infectivity.
(A, E, and I) Effect of PIs on viral entry. The dose-response curves of PIs at the entry step from Figure 2 were linearized by plotting log[(1 – fu)/fu)] vs. log(D/IC50). (B, F, and J) Effect of PIs on reverse transcription. qPCR was used to measure production of early reverse transcripts in primary CD4+ T lymphoblasts infected with pseudoviruses carrying an X4-tropic Env truncated in the CT of gp41 CT. PIs were present at the indicated concentration during virus production. (C, G, and K) Effect of PIs on all postentry steps. Flow cytometry was used to detect infection of primary CD4+ T lymphoblasts by pseudoviruses carrying a VSV-G. PIs were present at the indicated concentration during virus production. (D, H, and L) Reconstruction of overall dose-response curve of PIs by combining the dose-response curves at entry and postentry steps. A 2-step form of Equation 3 was used to combine best fit dose-response curves for PI effects on entry (blue line) and all postentry steps (red line). The resulting curves (dotted black lines) were compared with experimental results for the inhibition of infectivity by PIs (black circles).
Figure 4
Figure 4. Contribution of the inhibitory effect of PIs on each step of viral life cycle to the overall inhibitory effect at Cmax.
The linear dose-response curves of PIs at entry, reverse transcription, and post–reverse transcription steps were extrapolated to predict the inhibition of each step at Cmax.
Figure 5
Figure 5. Effect of PI-resistance mutations in the protease gene on inhibition of entry and postentry steps of viral life cycle.
(A) Effect of LPV-resistance mutations in the protease gene on HIV-1 entry. 293T cells were cotransfected with an NL4-3Δ Env vector expressing either WT protease or one with the protease mutations V82A or V82F, a vector expressing an X4-tropic HIV-1 envelope, and Blam-Vpr. Viruses were produced in the presence of increasing concentrations of LPV, and a highly sensitive FRET-based entry assay was then used to quantitate the amount of entry into primary CD4+ T cells. (B) Effect of PI-resistance mutations in the protease gene on postentry events. 293T cells were cotransfected with an NL4-3ΔEnv vector expressing either WT protease or one with the protease mutations V82A or V82F, and a vector expressing VSV-G. The transfected cells were then plated in 96-well plates, and LPV was added. Two days after the transfection, the viral supernatant was used to infect CD4+ lymphoblasts. Three days after infection, GFP-expressing cells were quantified using flow cytometry.
Figure 6
Figure 6. Importance of the entry effect on the analysis of resistance to PIs.
(A) Dependence of pseudoviruses with MLV-E on HIV-1 protease for entry. HIV-1 pseudoviruses with WT or mutant (D25N) protease and the indicated forms of MLV-E were used to infect CD4+ lymphoblasts, and entry was measured by FRET. (B) Effect of PI treatment of virus-producing cells on the entry of pseudoviruses with MLV-E. Pseudoviruses with the indicated forms of MLV-E and WT protease were generated in the presence of increasing concentrations of DRV and tested for entry into primary CD4+ T lymphoblasts using FRET. (C) DRV-mediated inhibition of infection of CD4+ T lymphoblasts by HIV-1 pseudoviruses with WT (p15) or truncated (p12) MLV-E. Infection was assessed by GFP expression in target cells. (D) The effect of target cell type on PI dose-response curves. HIV-1 pseudoviruses with WT MLV-E generated in the presence of increasing concentrations of DRV were used to infect 293T cells or primary CD4+ T lymphoblasts. Infection was assessed by GFP expression in target cells. (E) Comparison of DRV dose-response curves in experimental systems representing the clinical assay for resistance (MLV-E/293T) or in vivo infection (HIV-1 Env/CD4). HIV-1 pseudoviruses with MLV-E or HIV-1 Env were generated in the presence of increasing concentrations of DRV and used to infect 293T cells or primary CD4+ T lymphoblasts. Infection was assessed by GFP expression in target cells.
Figure 7
Figure 7. Effect of env mutations on PI resistance.
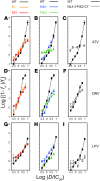
(A, D, and G) Mutations in Env can confer PI resistance. Pseudoviruses were generated with WT gag and pol genes and env genes E1 or E51 from a patient with high level PI resistance. Pseudoviruses were produced in the presence of various concentrations of the indicated PIs and used to infect CD4+ lymphoblasts. Three days later, the infection was quantified as the percentage of cells expressing GFP. Control WT infections were done with pseudoviruses carrying NL4-3 env. (B, E, and H) Envs from patients who failed PI-containing regimens without evidence of major PI mutations confer PI resistance. Pseudoviruses were generated with WT gag and pol genes and env genes cloned from patients PIE1 and PIE2 and analyzed as described above. (C, F, and I) Effect of mutations in the gp41 CT on PI sensitivity. Pseudoviruses generated with WT gag and pol and a chimeric NL4-3 env with the CT from PIE2 (NL4-3-PIE2-CT) were analyzed as above. Dose-response curves for ATV, DRV, and LPV are shown. Drug concentrations are normalized to the IC50 values for infectivity measured in (2) and are 13.6 nM, 23.6 nM, and 35.8 nM for ATV, DRV, and LPV, respectively.

Comment in

Similar articles

Cited by

References

    1. Thompson MA, et al. Antiretroviral treatment of adult HIV infection: 2010 recommendations of the international AIDS society-USA panel. JAMA. 2010;304(3):321–333. doi: 10.1001/jama.2010.1004. - DOI - PubMed
    1. Shen L, et al. Dose-response curve slope sets class-specific limits on inhibitory potential of anti-HIV drugs. Nat Med. 2008;14(7):762–766. doi: 10.1038/nm1777. - DOI - PMC - PubMed
    1. Anderson J, Schiffer C, Lee SK, Swanstrom R. Viral protease inhibitors. Handb Exp Pharmacol. 2009;(189):85–110. - PMC - PubMed
    1. Jilek BL, et al. A quantitative basis for antiretroviral therapy for HIV-1 infection. Nat Med. 2012;18(3):446–451. doi: 10.1038/nm.2649. - DOI - PMC - PubMed
    1. Perez-Valero I, Arribas JR. Protease inhibitor monotherapy. Curr Opin Infect Dis. 2011;24(1):7–11. doi: 10.1097/QCO.0b013e3283422cdf. - DOI - PubMed

Publication types

MeSH terms