

Gene-specific transcriptional mechanisms at the histone gene cluster revealed by single-cell imaging
- PMID: 23973376
- PMCID: PMC7659890
- DOI: 10.1016/j.molcel.2013.08.009
Gene-specific transcriptional mechanisms at the histone gene cluster revealed by single-cell imaging
Abstract
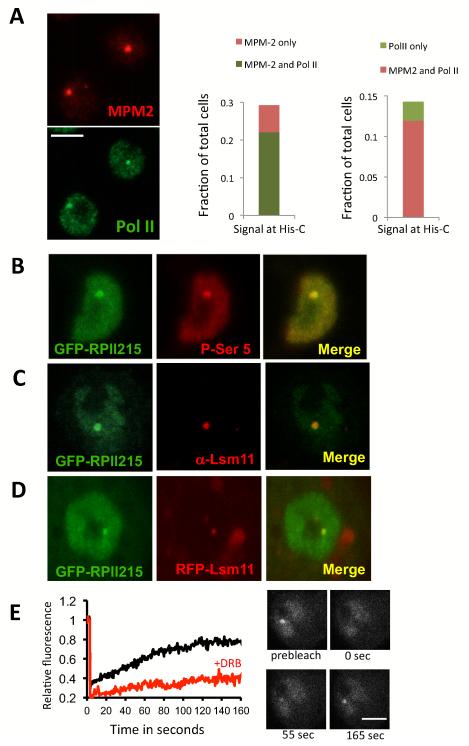
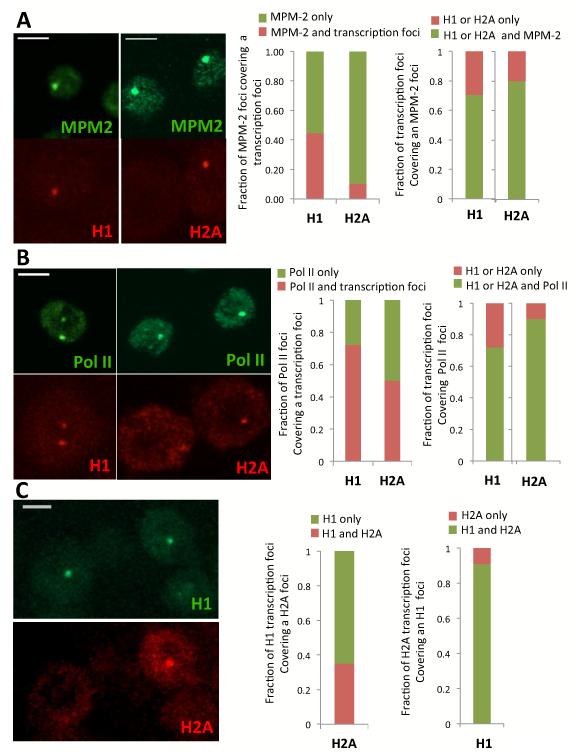
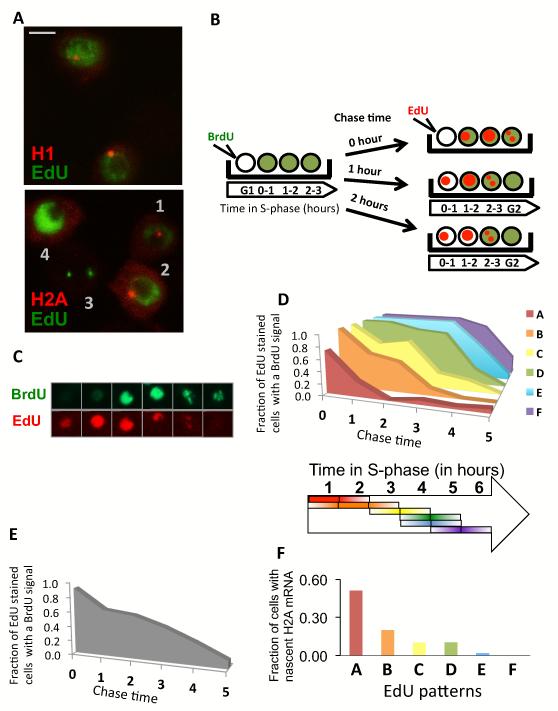
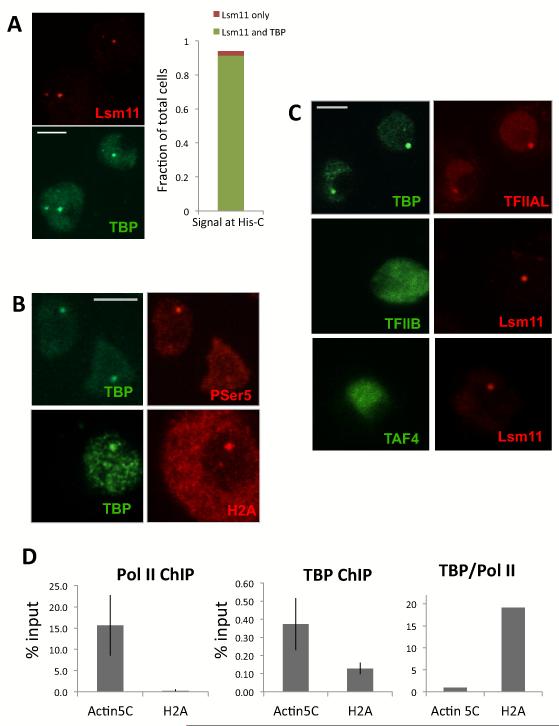
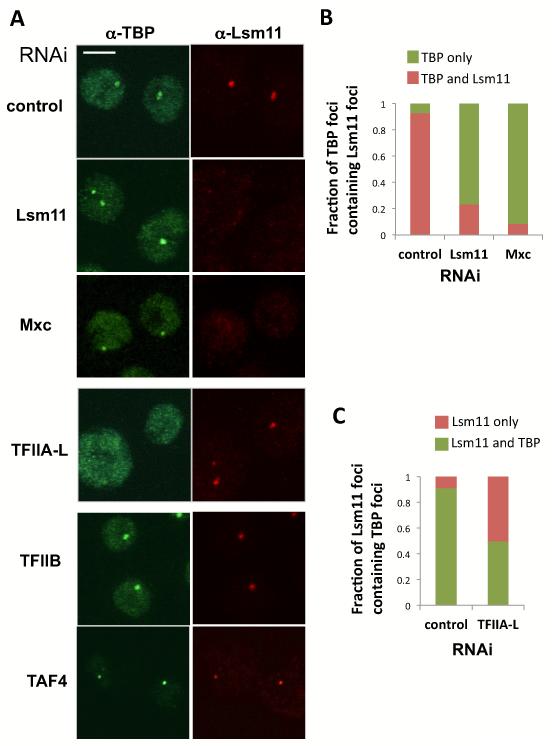
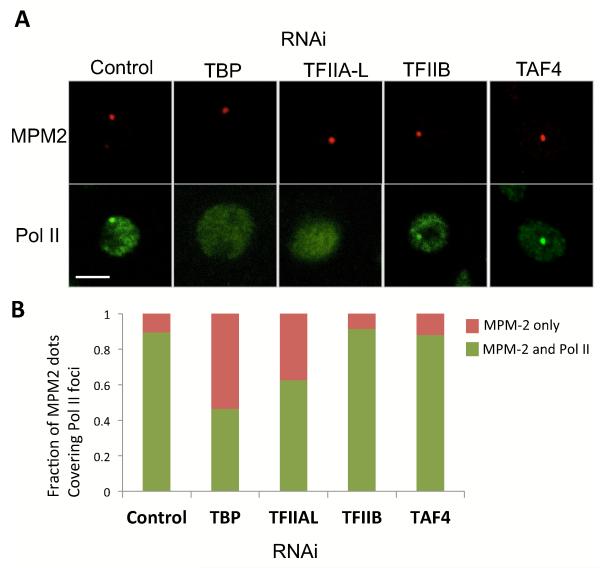
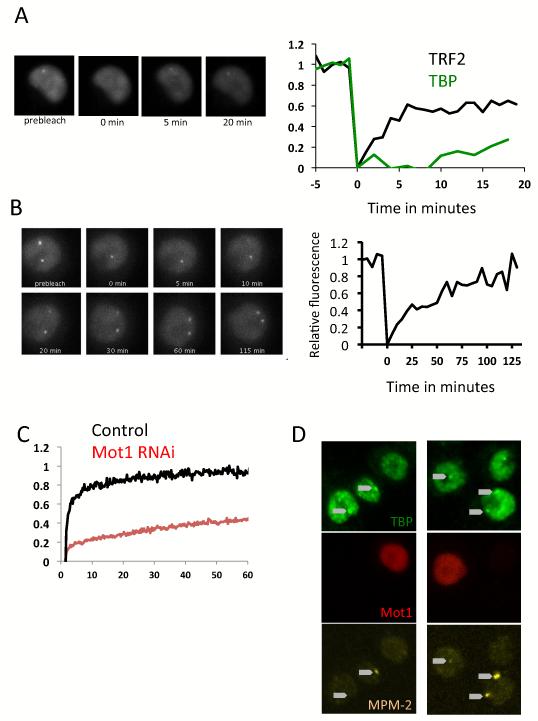
To bridge the gap between in vivo and in vitro molecular mechanisms, we dissected the transcriptional control of the endogenous histone gene cluster (His-C) by single-cell imaging. A combination of quantitative immunofluorescence, RNA FISH, and FRAP measurements revealed atypical promoter recognition complexes and differential transcription kinetics directing histone H1 versus core histone gene expression. While H1 is transcribed throughout S phase, core histones are only transcribed in a short pulse during early S phase. Surprisingly, no TFIIB or TFIID was detectable or functionally required at the initiation complexes of these promoters. Instead, a highly stable, preloaded TBP/TFIIA "pioneer" complex primes the rapid initiation of His-C transcription during early S phase. These results provide mechanistic insights for the role of gene-specific core promoter factors and implications for cell cycle-regulated gene expression.
Copyright © 2013 Elsevier Inc. All rights reserved.
Figures
Similar articles
-
A transcription factor IIA-binding site differentially regulates RNA polymerase II-mediated transcription in a promoter context-dependent manner.J Biol Chem. 2017 Jul 14;292(28):11873-11885. doi: 10.1074/jbc.M116.770412. Epub 2017 May 24. J Biol Chem. 2017. PMID: 28539359 Free PMC article.
-
Interactions of a DNA-bound transcriptional activator with the TBP-TFIIA-TFIIB-promoter quaternary complex.J Biol Chem. 2003 Mar 28;278(13):11495-501. doi: 10.1074/jbc.M211938200. Epub 2003 Jan 21. J Biol Chem. 2003. PMID: 12538582 Free PMC article.
-
Role for Nhp6, Gcn5, and the Swi/Snf complex in stimulating formation of the TATA-binding protein-TFIIA-DNA complex.Mol Cell Biol. 2004 Sep;24(18):8312-21. doi: 10.1128/MCB.24.18.8312-8321.2004. Mol Cell Biol. 2004. PMID: 15340090 Free PMC article.
-
Architecture of the multi-functional SAGA complex and the molecular mechanism of holding TBP.FEBS J. 2021 May;288(10):3135-3147. doi: 10.1111/febs.15563. Epub 2020 Sep 29. FEBS J. 2021. PMID: 32946670 Review.
-
SAGA and TFIID: Friends of TBP drifting apart.Biochim Biophys Acta Gene Regul Mech. 2021 Feb;1864(2):194604. doi: 10.1016/j.bbagrm.2020.194604. Epub 2020 Jul 14. Biochim Biophys Acta Gene Regul Mech. 2021. PMID: 32673655 Review.
Cited by
-
TRF2: TRansForming the view of general transcription factors.Transcription. 2015;6(1):1-6. doi: 10.1080/21541264.2015.1004980. Epub 2015 Jan 14. Transcription. 2015. PMID: 25588059 Free PMC article. Review.
-
Coordinating cell cycle-regulated histone gene expression through assembly and function of the Histone Locus Body.RNA Biol. 2017 Jun 3;14(6):726-738. doi: 10.1080/15476286.2016.1265198. Epub 2017 Jan 6. RNA Biol. 2017. PMID: 28059623 Free PMC article. Review.
-
Hinfp is a guardian of the somatic genome by repressing transposable elements.Proc Natl Acad Sci U S A. 2021 Oct 12;118(41):e2100839118. doi: 10.1073/pnas.2100839118. Proc Natl Acad Sci U S A. 2021. PMID: 34620709 Free PMC article.
-
Estrogen-induced chromatin decondensation and nuclear re-organization linked to regional epigenetic regulation in breast cancer.Genome Biol. 2015 Aug 3;16(1):145. doi: 10.1186/s13059-015-0719-9. Genome Biol. 2015. PMID: 26235388 Free PMC article.
-
Towards a 'Spot On' Understanding of Transcription in the Nucleus.J Mol Biol. 2021 Jul 9;433(14):167016. doi: 10.1016/j.jmb.2021.167016. Epub 2021 May 2. J Mol Biol. 2021. PMID: 33951451 Free PMC article. Review.
References
-
- Albright SR, Tjian R. TAFs revisited: more data reveal new twists and confirm old ideas. Gene. 2000;242:1–13. - PubMed
-
- Baum B, Cherbas L. Drosophila cell lines as model systems and as an experimental tool. Methods Mol Biol. 2008;420:391–424. - PubMed
-
- Dundr M, Hoffmann-Rohrer U, Hu Q, Grummt I. A Kinetic Framework for a Mammalian RNA Polymerase in Vivo. Science. 2002 - PubMed
Publication types
MeSH terms
Substances
Grants and funding
LinkOut - more resources
Full Text Sources
Other Literature Sources
Molecular Biology Databases
Miscellaneous
