. 2013 Jun 20;2(8):812-21.
doi: 10.1242/bio.20131941. eCollection 2013 Aug 15.

The responses of neural stem cells to the level of GSK-3 depend on the tissue of origin

Affiliations

The responses of neural stem cells to the level of GSK-3 depend on the tissue of origin

Tamara Holowacz et al. Biol Open. .

Abstract

Neural stem cells (NSCs) can be obtained from a variety of sources, but not all NSCs exhibit the same characteristics. We have examined how the level of glycogen synthase kinase-3 activity regulates NSCs obtained from different sources: the mouse embryonic striatum, embryonic hippocampus, and mouse ES cells. Growth of striatal NSCs is enhanced by mild inhibition of GSK-3 but not by strong inhibition that is accompanied by Wnt/TCF transcriptional activation. In contrast, the growth of hippocampal NSCs is enhanced by both mild inhibition of GSK-3 as well as stronger inhibition. Active Wnt/TCF signaling, which occurs normally in the embryonic hippocampus, is required for growth of neural stem and progenitor cells. In the embryonic striatal germinal zone, however, TCF signaling is normally absent and its activation inhibits growth of NSCs from this region. Using a genetic model for progressive loss of GSK-3, we find that primitive ES cell-derived NSCs resemble striatal NSCs. That is, partial loss of GSK-3 alleles leads to an increase in NSCs while complete ablation of GSK-3, and activation of TCF-signaling, leads to their decline. Furthermore, expression of dominant negative TCF-4 in the GSK-3-null background was effective in blocking expression of Wnt-response genes and was also able to rescue neuronal gene expression. These results reveal that GSK-3 regulates NSCs by divergent pathways depending on the tissue of origin. The responses of these neural precursor cells may be contingent on baseline Wnt/TCF signaling occurring in a particular tissue.

Keywords: ES cells; Neural stem cells; Neurosphere assay; Wnt signaling.


Conflict of interest statement

Competing interests: The authors have no competing interests to declare.

Figures

Fig. 1.
Fig. 1.
(A) The response of neural progenitors to TCF activation depends on the tissue source. When striatal neurosphere cells are exposed to the GSK-3 inhibitor, BIO, the size and number of neurospheres increases at low doses, but they decrease at the higher doses that activate a TCF-lacZ reporter. In contrast, growth of hippocampal neurospheres is improved following TCF activation at much higher doses of BIO. Data presented as mean±S.E.M. Two-way ANOVAs showed significant main effects of tissue type, F1,120 = 594.85, P<0.05; BIO dose, F5,120 = 4.719, P<0.05; and interaction, F5,120 = 14.055, P<0.05. Multiple comparisons using Holm–Sidak post-hoc tests revealed significant differences compared to controls at the doses indicated, *P<0.05. (B) Tissue for the neurosphere assay was obtained from the E13.5 ganglionic eminence (i.e. future striatum) and medial pallium (i.e. future hippocampus) as shown. Only the future hippocampus expresses a TCF-lacZ reporter (red). Green, β3-tubulin; blue, DAPI. Scale bar: 200 µm. (C) LacZ stain of striatal and hippocampal neurospheres after one week in culture. Positive staining of striatal neurospheres occurs only at higher BIO doses while that of hippocampal neurospheres occurs at all doses. Note that the high density of spheres in C is due to the intentional grouping of many spheres into single wells in preparation for lacZ staining. Spheres were originally cultured at clonal density.
Fig. 2.
Fig. 2.
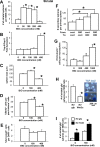
(A) When very low sub-micromolar doses of BIO are added to embryonic striatal neurosphere cultures, the number of neurospheres is dramatically increased, indicating an enhancement in growth of neural stem and progenitor cells. At a higher dose of BIO (400 nM), the number of spheres declines. Data presented as mean±S.E.M. One-way ANOVA showed a significant main effect for BIO dose, F2,25 = 8.758, P<0.05. Multiple comparisons using Holm–Sidak post-hoc test revealed significant differences compared to controls for 50 nM BIO, t10 = 3.787, *P<0.05; 100 nM BIO, t10 = 3.475, *P<0.05; and 200 nM BIO, t10 = 3.029, *P<0.05. (B) It was only at the higher dose of BIO (400 nM) that activation of the Top-5-TCF-luciferase reporter was observed. A significant main effect for BIO dose was seen, F3,32 = 20.527, *P<0.05. Multiple comparisons revealed a significant difference at 400 nM BIO, t16 = 6.426, *P<0.05. (C) At a low dose, BIO treated striatal neurospheres were significantly larger than untreated ones. This indicates that stem or progenitor cells within the neurospheres were undergoing either more proliferation or better cell survival. At the higher BIO dose, however, spheres did not grow as large as controls. A significant main effect for BIO dose was seen, F2,138 = 40.98, P<0.05. Multiple comparisons revealed significant differences compared to control at 100 nM BIO, t90 = 5.447, *P<0.05; and 400 nM BIO, t90 = 3.219, *P<0.05. (D) To monitor proliferation, neurospheres cells were labeled with a 1-hour pulse of BrdU. The number of BrdU+ cells was compared to the total number of cells. The number of proliferating cells was increased at the low dose of BIO, but decreased at the higher dose. A significant main effect for BIO dose was seen, F2,35 = 28.014, P<0.05. Multiple comparisons revealed significant differences compared to control at 100 nM BIO, t13 = 4.602,*P<0.05; and 400 nM BIO, t15 = 2.911, *P<0.05. (E) The number of cells positive for Activated caspase-3 relative to DAPI+ cells was not significantly changed at any dose of BIO. (One-way ANOVA, F2,21 = 0.860, P = 0.438). (F) When individual forebrain neurospheres were clonally passaged, low dose BIO treatment continued to generate more spheres only if present during passaging. This suggests that mild inhibition of GSK-3 enhances neural stem cell proliferation. The lack of a significant increase in neurosphere number after removal of BIO in the secondary passage indicates that stem cell self-renewal is not changed by BIO. A significant main effect for passaging regimen was seen, F3,143 = 2.806, P<0.05. Multiple comparisons revealed significant differences compared to control for control to BIO medium, t86 = 1.993, *P<0.05; and BIO to BIO medium, t15 = 2.733, *P<0.05. (G) When forebrain neurospheres were cultured in the presence of FGF-containing growth medium very few cells differentiate into neurons. Addition of a high dose of BIO induced expression of β3-tubulin indicative of precocious neuronal differentiation. A significant main effect for BIO dose was seen, F3,65 = 10.983, P<0.05. Multiple comparisons revealed significant differences compared to control at 1000 nM BIO, t73 = 4.784, *P<0.05. (H) Retroviral expression of Wnt-3a leads to reduction in the number of primary striatal neurospheres. This suggests that Wnt-3a works like the higher doses of BIO and does not support growth or survival of the striatal neural stem and progenitor cell population (t8 = 3.726, *P<0.05). Right panel: LacZ staining of striatal neurospheres from TCF-lacZ embryos showing expression of reporter (blue) following Wnt-3a expression. Scale bar: 200 µm. (I) Retroviral expression of dominant-negative TCF3 was used to inhibit canonical Wnt signaling and resulted in increases in the number of neurospheres in control conditions and with 100 nM BIO. A 2-way ANOVA showed significant main effects for retrovirus (F1,28 = 42.436, *P<0.05), BIO dose (F1,28 = 60.228, *P<0.05) with no interaction (F1,28 = 6.125). Multiple comparison procedures reveal a significant difference (*P<0.05) between retroviruses for control BIO (t14 = 4.373) and 100 nM BIO (t14 = 5.518).
Fig. 3.
Fig. 3.
(A) To monitor proliferation, E13.5 hippocampus-derived neurosphere cells were labeled with a 1-hour pulse of BrdU. The number of BrdU+ cells was compared to the total number of cells. The number of proliferating cells was increased in the presence of BIO in a dose dependent manner. A significant main effect was seen for BIO dose, F2,57 = 8.645, P<0.05. Holm–Sidak t-test showed significant differences compared to no BIO control; t38 = 3.405 for 200 nM BIO, *P<0.05; t38 = 3.769 for 400 nM BIO,*P<0.05. (B) Increasing amounts of BIO lead to progressive activation of the TCF-lacZ reporter relative to total protein. A significant main effect for BIO dose was seen, F2,32 = 3.522, *P<0.05. Multiple comparisons revealed a significant difference at 400 nM BIO, t16 = 2.735, *P<0.05. (C) Clonal passaging of hippocampal neurospheres is enhanced following retroviral expression of Wnt-3a. Data presented as mean±S.E.M. (t105 = 1.999, *P<0.05). (D) Retroviral expression of dominant-negative TCF3 was used to inhibit canonical Wnt signaling and resulted in decreases in the number of hippocampal neurospheres. A 2-way ANOVA showed significant main effects (*P<0.05) for retrovirus (F1,18 = 79.154), BIO dose (F2,18 = 6.363), with an interaction (F2,28 = 9.134). Multiple comparison procedures reveal a significant difference (*P<0.05) between retroviruses for control BIO (t6 = 3.286), 200 nM BIO (t6 = 6.419) and 400 nM BIO (t6 = 5.233).
Fig. 4.
Fig. 4.
(A) ES-cell-derived primitive neurospheres show the same biphasic response to BIO as embryonic striatal neurospheres, but not the increasing dose-dependent response of hippocampal neurosphere cells. Data presented as mean±S.E.M. One-way ANOVA showed significant differences for BIO dose; F4,23 = 19.605, P<0.05. Post-hoc t-tests showed significant increases compared to no BIO control: 100 nM BIO, t10 = 4.277, *P<0.05; and 200 nM BIO, t10 = 6.955, *P<0.05). (B) Secondary passage neurospheres generated from ES cell lines bearing different genetic levels of GSK-3 also show a biphasic response to the dose of GSK-3. The homozygous loss of either α or β subtypes of GSK-3 or loss of both α and one β subtype (i.e. the “3/4” mutant) results in enhancement of neural stem cells. GSK-3-null (double knockout, DKO) cells generated more neurospheres in primary but not secondary passages. Primary DKO spheres express the mesoderm-specific marker Brachyury (see panel C) and may represent persisting ES cell colonies or embryoid bodies. Upon secondary passaging, DKO spheres are dramatically decreased in number, while the knockout lines with intermediate levels of GSK-3 generate more neurospheres. For primary neurospheres, one-way ANOVA showed a significant effect of genotype, F4,94 = 10.402, P<0.05. Post-hoc t-tests showed significant increases compared to wildtype for the homozygous α mutant, t62 = 2.931, *P<0.05; the ¾ mutant, t62 = 2.768, *P<0.05; and the DKO mutant, t62 = 5.817, *P<0.05. For secondary neurospheres, one-way ANOVA also showed significant differences for genotype, F4,94 = 12.854, P<0.05. Post-hoc t-tests showed significant increases compared to wildtype for the homozygous α mutant, t60 = 2.726, *P<0.05; the homozygous β mutant, t60 = 3.610, *P<0.05; and the DKO mutant, t60 = 2.626, *P<0.05). (C) Quantitative PCR analysis of secondary neurospheres shows that Wnt-responsive genes are only active in DKO neurospheres. One-way ANOVAs performed for each marker showed significant effect of genotype (F4,10 = 2381.74 for Axin2, F4,10 = 1083.49 for LEF1, F4,10 = 2.7×10⁵ for Brachyury). Post hoc t-tests showed significant differences for the DKO line compared to wildtype for each marker (t3 = 77.256 for Axin2, t3 = 77.256 for LEF1, t3 = 77.256 for Brachyury, *P<0.05).
Fig. 5.
Fig. 5.
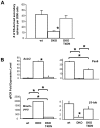
(A) TCF signaling is not required for the generation of ES-derived neural stem cells. Loss of all alleles of GSK-3 (DKO) leads to loss of secondary ES-derived neurospheres (because they switch to a mesodermal fate). However, when TCF signaling is blocked in these cells with dominant negative TCF-4 (T4DN), spheres are regained. Data presented as mean±S.E.M. One-way ANOVA showed a significant effect of genotype, F2,42 = 9.071. Holm–Sidak t-tests showed significant difference for the DKO line, t29 = 3.958, *P<0.05. (B) Dominant negative TCF-4 in the GSK-3-DKO background rescues neural progenitors. Quantitative PCR analysis shows that blocking TCF signaling downregulates expression of Wnt response genes Axin2 and Brachyury in GSK-3-DKO ES-derived neurospheres. Dominant negative TCF4 also rescues expression of the neural progenitor marker, Pax6, and the early neural differentiation marker, β3-tubulin. Data represent means±S.E.M. One-way ANOVAs performed for each marker showed significant effect of genotype (F2,6 = 1184.05 for Axin2, F2,6 = 136.6 for Pax6, F2,6 = 5.6×10⁵ for Brachyury, F2,6 = 7.999 for β3-tubulin). Multiple comparisons using Holm–Sidak post-hoc t-tests revealed significant differences as indicated, *P<0.05.

Similar articles

Cited by

References

    1. Anton R., Kestler H. A., Kühl M. (2007). Beta-catenin signaling contributes to stemness and regulates early differentiation in murine embryonic stem cells. FEBS Lett. 581, 5247–5254 10.1016/j.febslet.2007.10.012 - DOI - PubMed
    1. Aubert J., Dunstan H., Chambers I., Smith A. (2002). Functional gene screening in embryonic stem cells implicates Wnt antagonism in neural differentiation. Nat. Biotechnol. 20, 1240–1245 10.1038/nbt763 - DOI - PubMed
    1. Barker N., van Es J. H., Kuipers J., Kujala P., van den Born M., Cozijnsen M., Haegebarth A., Korving J., Begthel H., Peters P. J. et al. (2007). Identification of stem cells in small intestine and colon by marker gene Lgr5. Nature 449, 1003–1007 10.1038/nature06196 - DOI - PubMed
    1. Bonaguidi M. A., Wheeler M. A., Shapiro J. S., Stadel R. P., Sun G. J., Ming G. L., Song H. (2011). In vivo clonal analysis reveals self-renewing and multipotent adult neural stem cell characteristics. Cell 145, 1142–1155 10.1016/j.cell.2011.05.024 - DOI - PMC - PubMed
    1. Chenn A., Walsh C. A. (2002). Regulation of cerebral cortical size by control of cell cycle exit in neural precursors. Science 297, 365–369 10.1126/science.1074192 - DOI - PubMed

LinkOut - more resources