. 2013 Aug 9;8(8):e69987.
doi: 10.1371/journal.pone.0069987. eCollection 2013.

Immunohistochemical, ultrastructural and functional analysis of axonal regeneration through peripheral nerve grafts containing Schwann cells expressing BDNF, CNTF or NT3

Affiliations

Immunohistochemical, ultrastructural and functional analysis of axonal regeneration through peripheral nerve grafts containing Schwann cells expressing BDNF, CNTF or NT3

Maria João Godinho et al. PLoS One. .

Abstract

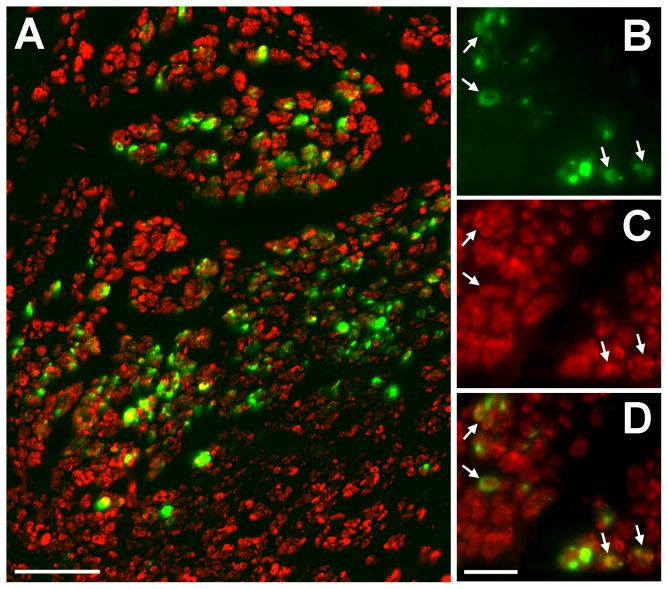
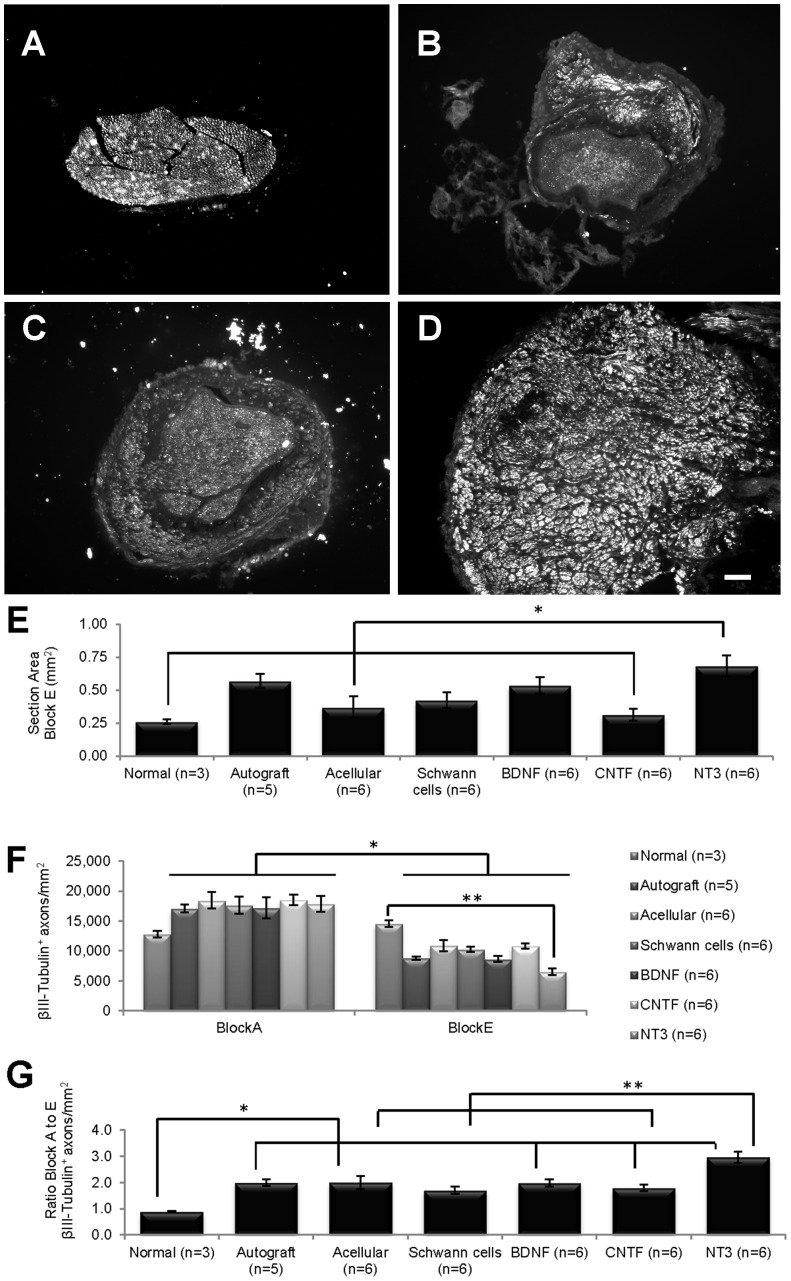
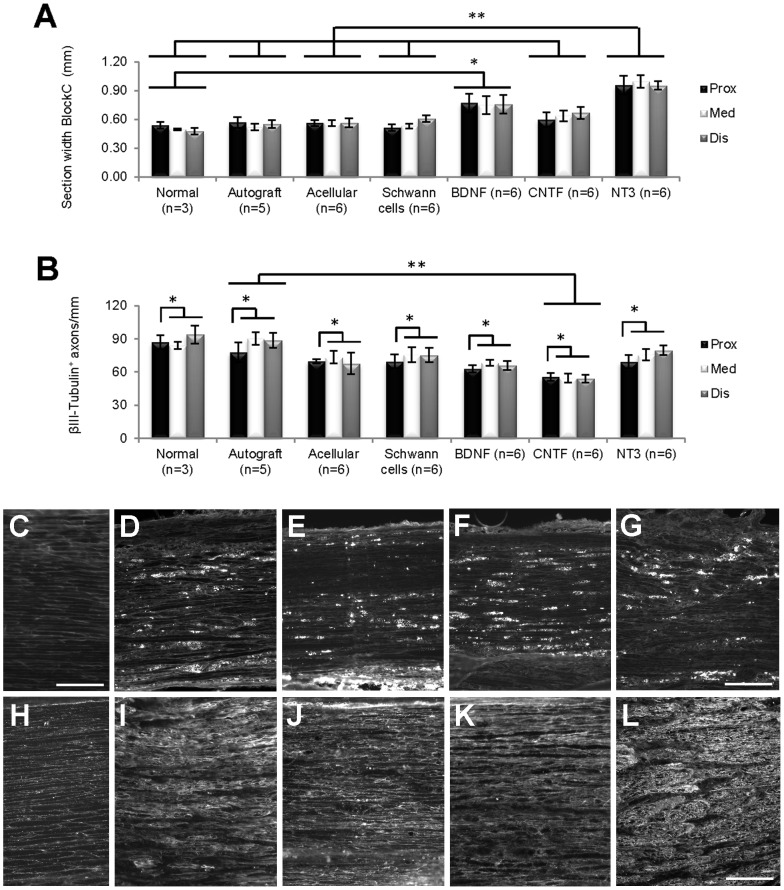
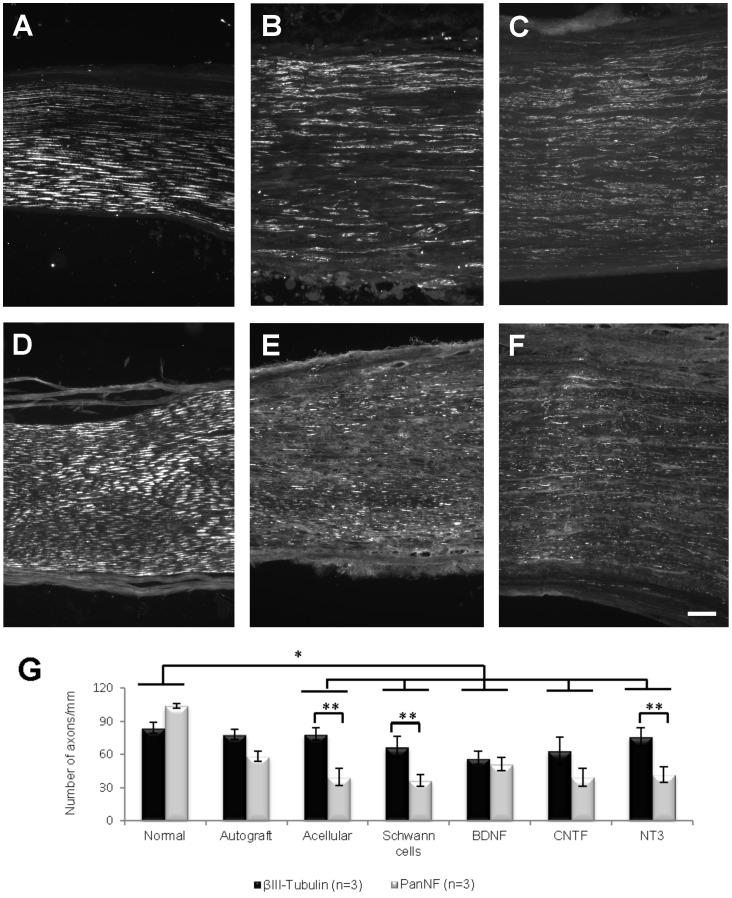
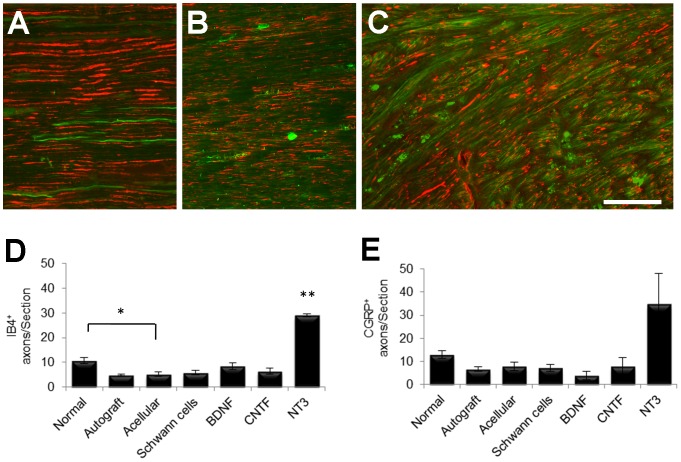
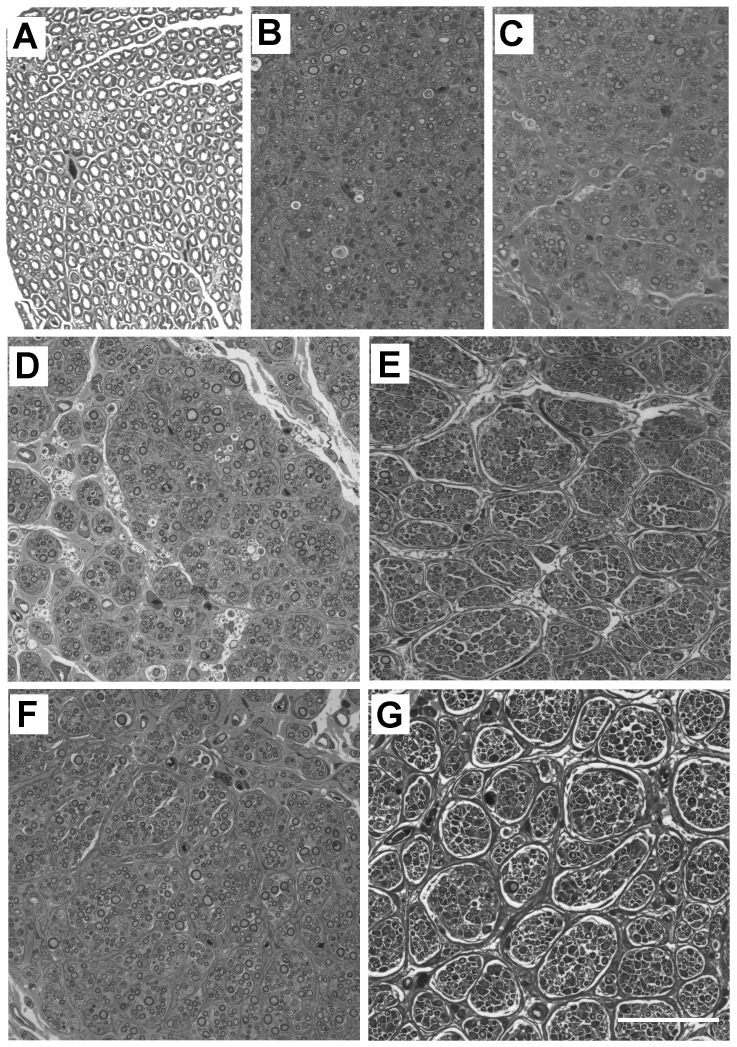
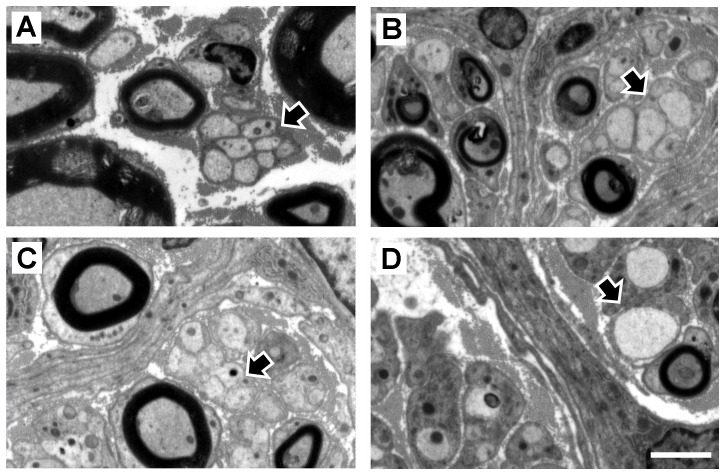
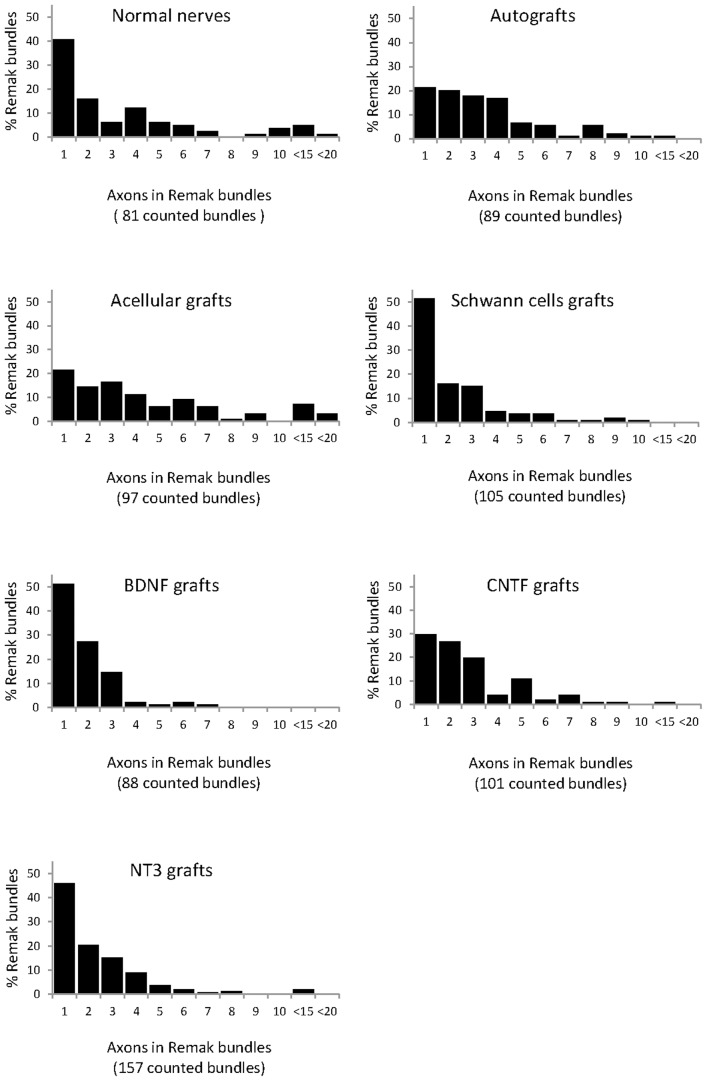
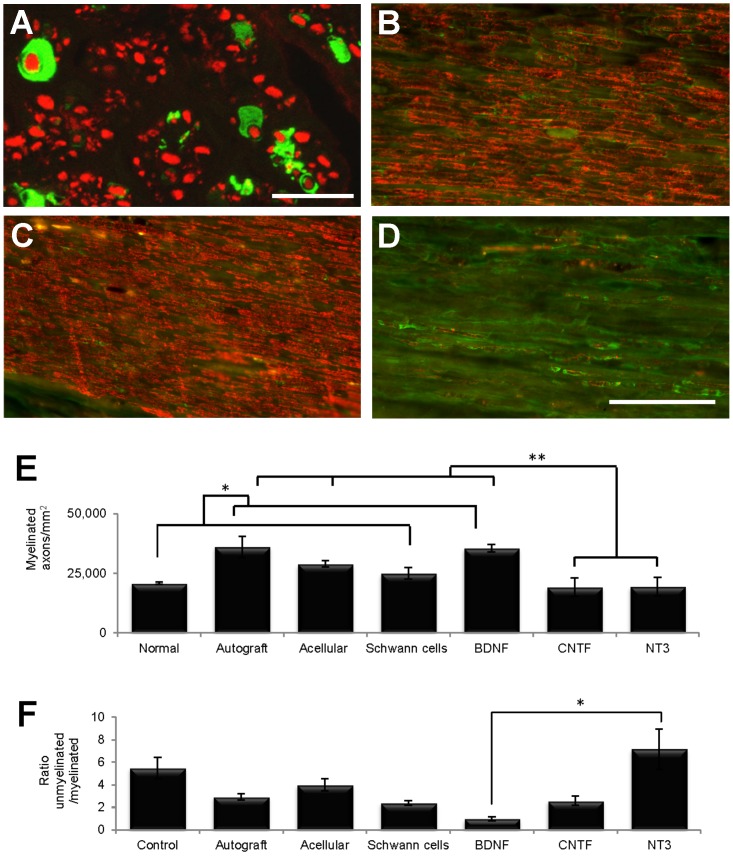
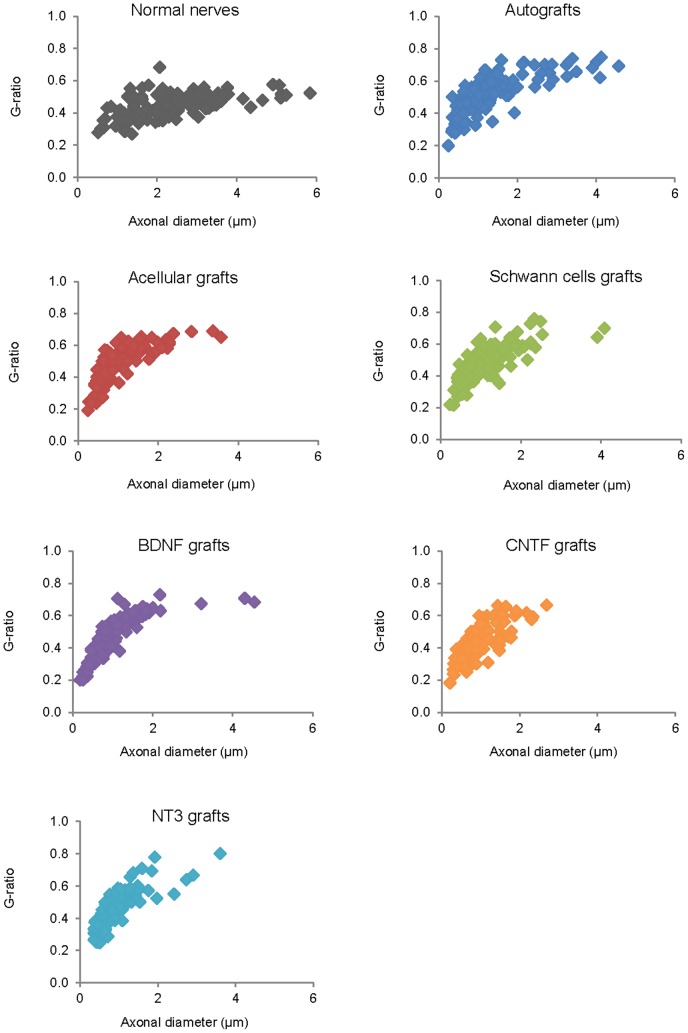
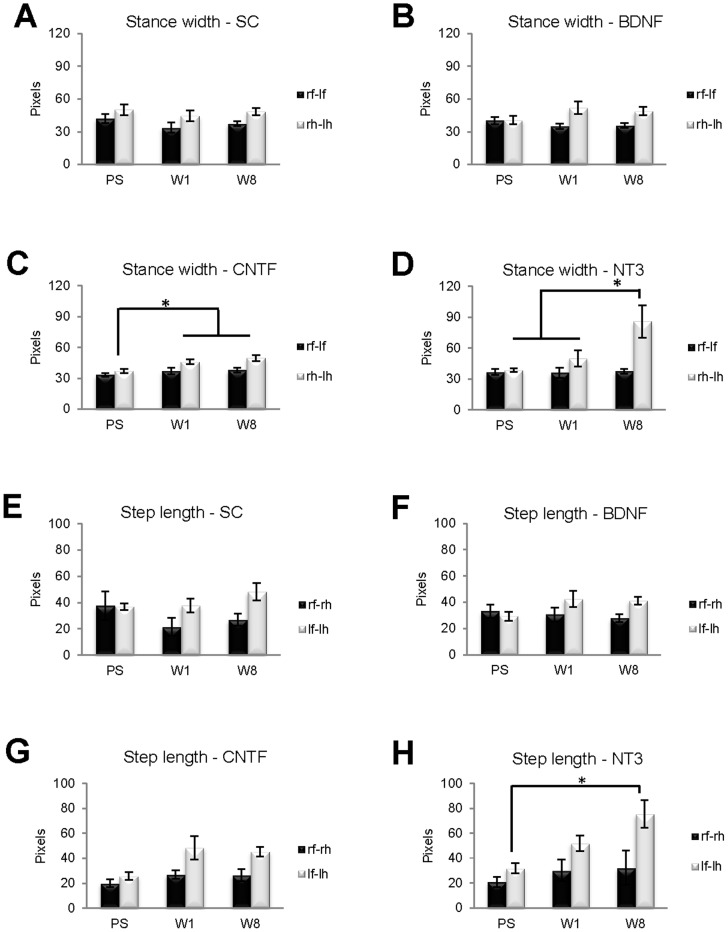
We used morphological, immunohistochemical and functional assessments to determine the impact of genetically-modified peripheral nerve (PN) grafts on axonal regeneration after injury. Grafts were assembled from acellular nerve sheaths repopulated ex vivo with Schwann cells (SCs) modified to express brain-derived neurotrophic factor (BDNF), a secretable form of ciliary neurotrophic factor (CNTF), or neurotrophin-3 (NT3). Grafts were used to repair unilateral 1 cm defects in rat peroneal nerves and 10 weeks later outcomes were compared to normal nerves and various controls: autografts, acellular grafts and grafts with unmodified SCs. The number of regenerated βIII-Tubulin positive axons was similar in all grafts with the exception of CNTF, which contained the fewest immunostained axons. There were significantly lower fiber counts in acellular, untransduced SC and NT3 groups using a PanNF antibody, suggesting a paucity of large caliber axons. In addition, NT3 grafts contained the greatest number of sensory fibres, identified with either IB4 or CGRP markers. Examination of semi- and ultra-thin sections revealed heterogeneous graft morphologies, particularly in BDNF and NT3 grafts in which the fascicular organization was pronounced. Unmyelinated axons were loosely organized in numerous Remak bundles in NT3 grafts, while the BDNF graft group displayed the lowest ratio of umyelinated to myelinated axons. Gait analysis revealed that stance width was increased in rats with CNTF and NT3 grafts, and step length involving the injured left hindlimb was significantly greater in NT3 grafted rats, suggesting enhanced sensory sensitivity in these animals. In summary, the selective expression of BDNF, CNTF or NT3 by genetically modified SCs had differential effects on PN graft morphology, the number and type of regenerating axons, myelination, and locomotor function.


Conflict of interest statement

Competing Interests: The authors have declared that no competing interests exist.

Figures

Figure 1
Figure 1. Tissue sampling protocol and Ratwalk® schematic.
(A) Each grafted nerve was divided into blocks: proximal host nerve stump (Block A), proximal suture (Block B), graft itself (Block C), distal suture (Block D), and distal host nerve stump (Block E). Either cross sections (circles) from Blocks A and E or longitudinal sections (rectangles) from Block C were collected for immunohistochemistry. Additionally, a block was taken from the distal end of 3 grafts from each group to collect semi- and ultra-thin cross-sections for electron microscopy (EM). (B, C) Functional recovery was assessed using the Ratwalk® [side view of the setup (B)], consisting of a glass walking platform [front view (C)] attached to a box containing a fluorescence bulb from which the light escapes only through a narrow slit into the glass. Light is scattered from the glass at each point of contact with the animals' paws. Walks were recorded and analyzed using the Ratwalk® software (images B and C modified from 30).
Figure 2
Figure 2. Survival of Schwann cells in reconstituted peripheral nerve grafts.
(A) Low power view showing GFP and S100 positive cellular profiles in a section from the middle of a SC-GFP graft. Higher power views demonstrate: (B) continued GFP transgene expression in grafted SCs; (C) cells positively immunostained with the SC marker S100; (D) arrowed GFP and S100 double labelled cells in a combined image. Scale bars: A = 50 µm; B–D = 20 µm.
Figure 3
Figure 3. βIII-Tubulin+ immunostaining in nerve cross-sections.
(A–D) Cross-sections of normal nerve (A) and of distal host nerve stumps of acellular (B), CNTF (C) and NT3 (D) grafts. (E) Cross-sectional areas of NT3 grafts were significantly larger (*) than areas of normal nerves and of acellular and CNTF grafts. (F) The density of βIII-Tubulin+ axons/mm2 in all grafted nerves was significantly greater (*) in proximal (Block A) than in distal (Block E) stumps, and greater (**) in the normal versus NT3 group in Block E. (G) The ratio of βIII-Tubulin+ axons/mm2 between nerve stumps was significantly lower in normal nerves than in grafts (*), except those with unmodified SCs. The ratio in the NT3 group was significantly greater (**) than in acellular, SCs and CNTF groups. Values represent M ± SEM; p<0.0005 in E and G and p<0.05 in F. Further details on statistical analysis provided as Statistical Information S1. Scale bar for A–D: 100 µm.
Figure 4
Figure 4. Analysis of longitudinal graft sections.
(A) Within the grafts themselves (Block C), longitudinal sections of BDNF grafts were significantly wider (*) than normal nerves, and sections of NT3 grafts were significantly wider (**) than those of normal nerves, autograft, acellular, SCs and CNTF grafts. (B) Overall, the number of βIII-Tubulin+ axons/mm in longitudinal sections differed between the proximal and other counting distances (*), with sections of autografts containing significantly more axons (**) compared to CNTF grafts. Values represent M ± SEM; p<0.025 in A and p<0.05 in B. Further details on statistical analysis provided as Statistical Information S1. (C–G) ED1 immunostaining; C normal PN; D–G, acellular, BDNF, CNTF and NT3 grafts respectively. (H–L) laminin immunostaining; F, normal PN; G–L, acellular, BDNF, CNTF and NT3 grafts respectively. Scale for D–G = 200 µm, for C, H–L = 100 µm.
Figure 5
Figure 5. Representative examples of longitudinal sections of normal nerve (A and D), SCs (B and E) and NT3 (C and F) grafts immunostained with βIII-Tubulin (A–C) or PanNF (D–F).
Images are series of sections from the same nerve or graft. (G) The difference between βIII-Tubulin+ and PanNF+ axons/mm in the normal group was significantly different from that observed in all groups except the autograft group (*). The numbers of axons/mm identified by each axonal marker were significantly different (**) in the acellular, SCs and NT3 groups. Values represent M ± SEM and p<0.05. Further details on statistical analysis provided as Statistical Information S1. Scale bar for A–F: 100 µm.
Figure 6
Figure 6. Examples of longitudinal sections of normal (A), autograft (B) and NT3 graft (C) stained with PanNF (red) and IB4 (green).
(D) Quantification revealed significantly greater numbers of IB4 + axons in normal nerves compared to acellular grafts (*) and in NT3 grafts compared to all other experimental groups (**). (E) The number of CGRP+ axons was not significantly different between experimental groups. Values represent M ± SEM of n = 3; p<0.05. Further details on statistical analysis provided as Statistical Information S1. Scale bar for A–C: 100 µm.
Figure 7
Figure 7. Fascicular architecture in grafts.
Semi-thin sections of a normal nerve (A), an autograft (B), and acellular (C), SCs (D), BDNF (E), CNTF (F) and NT3 (G) grafts. Note the pronounced fascicular organization in SC reconstituted grafts, especially in E and G. Scale bar for A–G: 50 µm.
Figure 8
Figure 8. Unmyelinated axons in Remak bundles.
These axons (black arrows) are shown in representative electron micrographs of normal nerve (A), BDNF (B), CNTF (C) and NT3 (D) grafts. Scale bar for A–D: 2.5 µm.
Figure 9
Figure 9. Occurrence and number of axons in Remak bundles, with pooling of counts between 10–15 and 15–20 axons in bundles.
Figure 10
Figure 10. Myelination of regenerating axons within grafts.
(A) In the pilot sciatic nerve experiment, cross-sections from the middle of GFP-SC grafts showed profiles with typical SC morphology (green) surrounding axons labelled with PanNF (red). (B–D) In the main peroneal graft experiment, comparison of longitudinal sections immunostained with S100 (green) and MBP (red) showed that normal nerves (B) had less myelin than autografts (C) and more myelin than NT3 grafts (D). (E) Quantification of semi-thin sections revealed that the number of myelinated axons/mm2 in normal nerves and SCs grafts was significantly lower (*) than in autografts and BDNF grafts, and the numbers in the latter two and in acellular grafts were significantly greater (**) than in CNTF and NT3 grafts. (F) The ratio of unmyelinated to myelinated axons in the BDNF group was significantly less than in the NT3 group. Values represent M ± SEM of n = 3; p<0.05. Further details on statistical analysis provided as Statistical Information S1. Scale bars: 10 µm in A; 100 µm for B–D.
Figure 11
Figure 11. G-ratios of myelinated fibers in each experimental group (120 fibers measured in each group).
Note the greater number of large diameter axons in normal nerve and in autografts, the G-ratio in the latter being the highest of all experimental groups and significantly higher than in the normal, BDNF, CNTF and NT3 groups. The G-ratio values were also significantly lower in normal nerves compared to acellular grafts and significantly higher in SC compared to CNTF grafts (see also Table 3). Further details on statistical analysis provided as Statistical Information S1.
Figure 12
Figure 12. Locomotor function of rats from SC, BDNF, CNTF and NT3 groups prior to surgery (PS), and at one (W1) and eight (W8) weeks after surgery, was analyzed from digitized recordings using the Ratwalk® software.
Two quantitative parameters generated by this software were analyzed: stance width (A–D) and step length (E–H). There were significant differences in both parameters in distances involving the injured left hindlimbs. Namely, the stance width of hindlimbs (rh-lh) in the CNTF group significantly increased from PS (* in C) to W1 and W8, and in the NT3 group it was significantly greater in W8 (* in D) than in both W1 and PS. Regarding the step length on the left (lf-lh), in the NT3 group there was a significant increase (* in H) from PS to W8. There were no significant differences in either the SC or BDNF groups on the two gait parameters analyzed. Values represent M ± SEM of n = 4; p<0.05.

Similar articles

Cited by

References

    1. Lundborg G (2000) A 25-year perspective of peripheral nerve surgery: evolving neuroscientific concepts and clinical significance. J Hand Surg 35A: 391–414. - PubMed
    1. Ray WZ, Mackinnon SE (2010) Management of nerve gaps: autografts, allografts, nerve transfers, and end-to-side neurorrhaphy. Exp Neurol 223: 77–85. - PMC - PubMed
    1. Dahlin LB, Brandt J (2004) Basic science of peripheral nerve repair: wallerian degeneratioMJG LTn/growth cones. Oper Techn Orthopaed 14: 138–145.
    1. Höke A, Redett R, Hameed H, Jari R, Zhou C, et al. (2006) Schwann cells express motor and sensory phenotypes that regulate axon regeneration. J Neurosci 26: 9646–9655. - PMC - PubMed
    1. Gordon T, Tyreman N, Raji MA (2011) The basis for diminished functional recovery after delayed peripheral nerve repair. J Neurosci 31: 5325–5334. - PMC - PubMed

Publication types

MeSH terms

Grants and funding

The work and MJG were partially supported in the early stages by funds from the Princess Margaret Hospital for Children, Subiaco, Australia. MJG was supported by an Australian Postgraduate Award from The University of Western Australia and by a Mary and Elsie Stevens Bursary from the Australian Federation of University Women (Western Australia). Aspects of this work were supported by grants from the NHMRC and WA Neurotrauma Research Program. The funders had no role in study design, data collection and analysis, decision to publish, or preparation of the manuscript.