Initial characterization of histone H3 serine 10 O-acetylation
- PMID: 23949383
- PMCID: PMC3891691
- DOI: 10.4161/epi.26025
Initial characterization of histone H3 serine 10 O-acetylation
Abstract
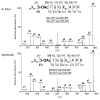
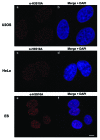
In eukaryotic organisms, histone posttranslational modifications (PTMs) are indispensable for their role in maintaining cellular physiology, often through their mediation of chromatin-related processes such as transcription. Targeted investigations of this ever expanding network of chemical moieties continue to reveal genetic, biochemical, and cellular nuances of this complex landscape. In this study, we present our findings on a novel class of histone PTMs: Serine, Threonine, and Tyrosine O-acetylation. We have combined highly sensitive nano-LC-MS/MS experiments and immunodetection assays to identify and validate these unique marks found only on histone H3. Mass spectrometry experiments have determined that several of these O-acetylation marks are conserved in many species, ranging from yeast to human. Additionally, our investigations reveal that histone H3 serine 10 acetylation (H3S10ac) is potentially linked to cell cycle progression and cellular pluripotency. Here, we provide a glimpse into the functional implications of this H3-specific histone mark, which may be of high value for further studies of chromatin.
Keywords: chromatin; epigenetics; histone; mass spectrometry; post-translational modifications; proteomics; quantitative; stem cells.
Figures


Similar articles
-
Organismal differences in post-translational modifications in histones H3 and H4.J Biol Chem. 2007 Mar 9;282(10):7641-55. doi: 10.1074/jbc.M607900200. Epub 2006 Dec 28. J Biol Chem. 2007. PMID: 17194708
-
Systems Level Analysis of Histone H3 Post-translational Modifications (PTMs) Reveals Features of PTM Crosstalk in Chromatin Regulation.Mol Cell Proteomics. 2016 Aug;15(8):2715-29. doi: 10.1074/mcp.M115.054460. Epub 2016 Jun 14. Mol Cell Proteomics. 2016. PMID: 27302890 Free PMC article.
-
Global assessment of combinatorial post-translational modification of core histones in yeast using contemporary mass spectrometry. LYS4 trimethylation correlates with degree of acetylation on the same H3 tail.J Biol Chem. 2007 Sep 21;282(38):27923-34. doi: 10.1074/jbc.M704194200. Epub 2007 Jul 24. J Biol Chem. 2007. PMID: 17652096
-
Histone post-translational modifications regulate transcription and silent chromatin in Saccharomyces cerevisiae.Ernst Schering Res Found Workshop. 2006;(57):127-53. doi: 10.1007/3-540-37633-x_8. Ernst Schering Res Found Workshop. 2006. PMID: 16568953 Review.
-
Posttranslational modifications of human histone H3: an update.Proteomics. 2014 Sep;14(17-18):2047-60. doi: 10.1002/pmic.201300435. Epub 2014 Aug 8. Proteomics. 2014. PMID: 25044606 Review.
Cited by
-
Post-translational modifications in liquid-liquid phase separation: a comprehensive review.Mol Biomed. 2022 May 11;3(1):13. doi: 10.1186/s43556-022-00075-2. Mol Biomed. 2022. PMID: 35543798 Free PMC article. Review.
-
Quantitative proteomic analysis of histone modifications.Chem Rev. 2015 Mar 25;115(6):2376-418. doi: 10.1021/cr500491u. Epub 2015 Feb 17. Chem Rev. 2015. PMID: 25688442 Free PMC article. Review. No abstract available.
-
Cataloging Posttranslational Modifications in Plant Histones.Adv Exp Med Biol. 2021;1346:131-154. doi: 10.1007/978-3-030-80352-0_8. Adv Exp Med Biol. 2021. PMID: 35113400
-
The mitochondrial ADP/ATP carrier exists and functions as a monomer.Biochem Soc Trans. 2020 Aug 28;48(4):1419-1432. doi: 10.1042/BST20190933. Biochem Soc Trans. 2020. PMID: 32725219 Free PMC article. Review.
-
Analytical tools and current challenges in the modern era of neuroepigenomics.Nat Neurosci. 2014 Nov;17(11):1476-90. doi: 10.1038/nn.3816. Epub 2014 Oct 28. Nat Neurosci. 2014. PMID: 25349914 Free PMC article. Review.
References
Publication types
MeSH terms
Substances
Grants and funding
LinkOut - more resources
Full Text Sources
Other Literature Sources
Molecular Biology Databases
Miscellaneous
